


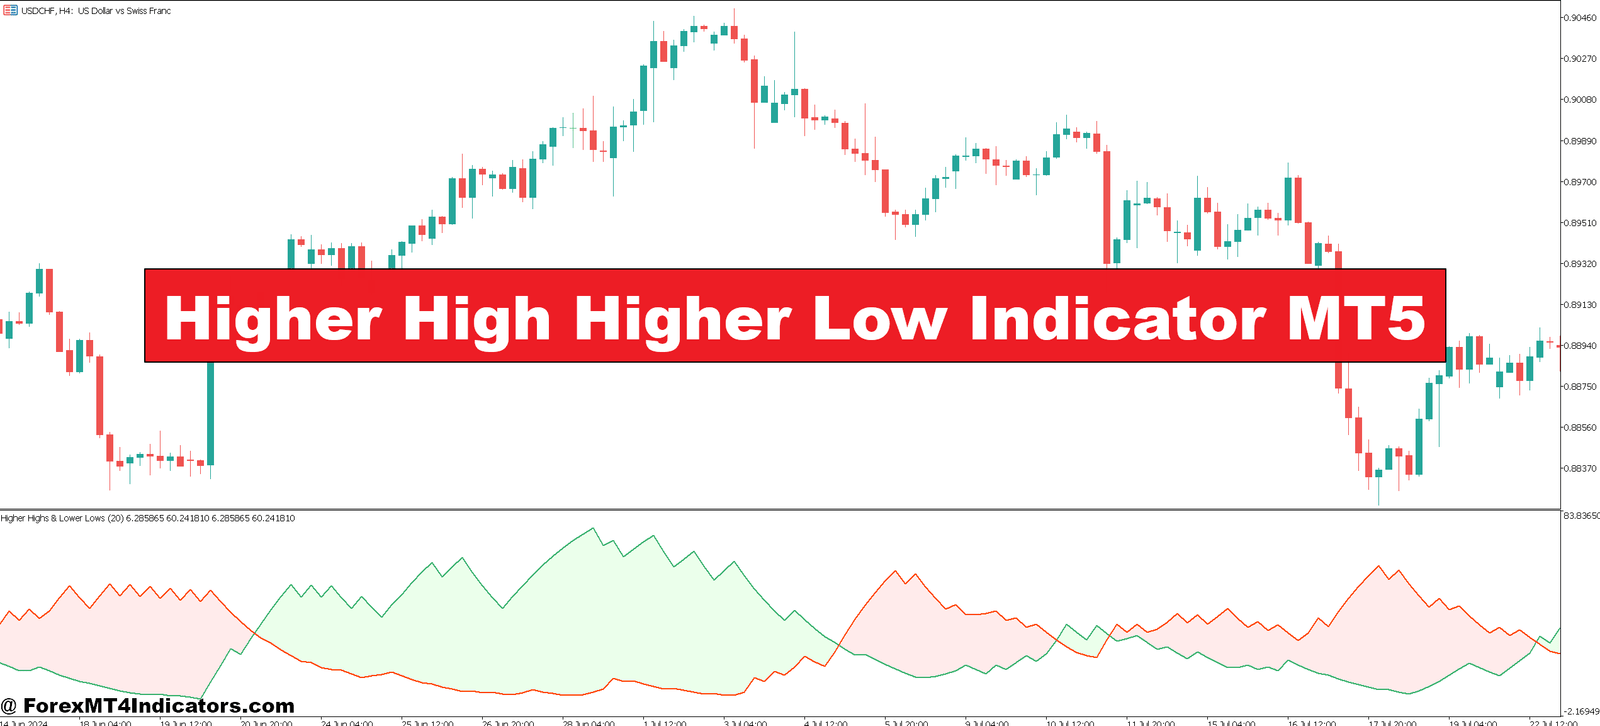

The Higher High Higher Low indicator for MT5 addresses this by doing one thing exceptionally well: it marks swing points and validates trend structure automatically. When price creates higher highs and higher lows in an uptrend (or lower highs and lower lows in a downtrend), the indicator confirms it visually. No guesswork, no subjective interpretation—just clear structure validation.
What the Higher High Higher Low Indicator Actually Does
The HHHL indicator identifies and labels swing points on your chart. It scans price action to detect when recent highs exceed previous highs (higher highs) and recent lows stay above previous lows (higher lows) in uptrends. For downtrends, it flags lower highs and lower lows.
Think of it as an automated structure analyst. Where you might manually mark swing points with horizontal lines, this tool does it programmatically. It plots markers or labels at each significant swing, often using arrows or text to distinguish between higher and lower points.
The real value isn’t just marking swings—it’s the confirmation layer. When you see a sequence of HH and HL forming, you have objective evidence that the uptrend structure remains healthy. Break that pattern, and you get an early warning that the trend might be weakening.
The Calculation Logic Behind Swing Point Detection

This indicator uses a lookback period to define swings. Most versions default to a 5-10 bar lookback, meaning it compares the current high or low against the highest high or lowest low from the previous 5-10 bars.
Here’s how it works in practice: The indicator continuously monitors recent price bars. When a high forms that exceeds the highest point in the lookback window, it marks a potential swing high. It then compares this swing high to the previous confirmed swing high. If it’s higher, you get an HH marker. The same process applies to lows for HL identification.
The calculation filters out minor fluctuations. On GBP/JPY’s 4-hour chart, for instance, intraday noise gets ignored while meaningful swings get flagged. This filtering prevents the indicator from marking every tiny bump as a swing point, which would clutter your chart and dilute the signal quality.
Some versions add a confirmation requirement—the swing doesn’t get marked until a certain number of bars close without breaking it. This lag trades real-time speed for reliability, reducing false swing identifications during choppy periods.
Real Trading Application: Timing Entries with Structure Confirmation
The indicator shines when used as an entry filter alongside price action. Let’s say you’re trading AUD/USD on the daily timeframe. Price has been climbing, and you’re waiting for a pullback to enter long.
A typical pullback forms. Price dips but holds above the previous swing low. The HHHL indicator marks this as a higher low. You’re watching, but you don’t enter yet. Price then pushes up and breaks the previous swing high. The indicator marks a higher high. Now you have confirmation: the uptrend structure is intact.
Your entry trigger might be a break of the pullback’s high, with your stop below the newly confirmed higher low. The indicator didn’t tell you to enter—it confirmed that the structure supports a long bias.
Here’s where traders mess this up: They see HH/HL markers and assume every swing point is an entry signal. It’s not. The indicator confirms structure; your strategy determines entries. On volatile news days, like when NFP data drops, you might see rapid HH/HL sequences that don’t represent tradeable trends—just volatility spikes.
The tool works best on higher timeframes (4-hour and daily) where swing structure is more meaningful. On the 5-minute chart, you’ll get constant signals that don’t capture significant trend phases.
Customizing Settings for Different Markets and Timeframes

The primary adjustment is the lookback period. A shorter period (3-5 bars) makes the indicator more sensitive, marking swings faster but increasing false signals during ranging markets. A longer period (10-15 bars) smooths out the identification, catching only major swings but adding lag.
For scalpers using 15-minute charts on EUR/GBP during London session, a 3-5 bar lookback might work because you need quicker swing identification. But for position traders on weekly USD/JPY charts, a 10-bar or higher setting filters noise better.
Some indicator versions let you adjust the confirmation bars—how many bars must close before a swing gets marked. Increasing this from 0 to 2-3 bars reduces premature swing labeling in choppy conditions. During Asian session ranges on USD/CHF, this extra confirmation prevents the indicator from marking every minor wiggle.
Visual customization matters too. You can typically change arrow colors, sizes, and whether the indicator displays text labels (HH, HL, LH, LL). Traders who stack multiple pairs on one screen often reduce marker size to avoid visual clutter.
One practical tip: Test your settings in a demo environment across different market conditions. What works for trending EUR/USD might fail on range-bound AUD/NZD.
Strengths and Honest Limitations

The indicator’s biggest advantage is objectivity. It removes the “is this really a higher high?” debate from your analysis. You either have confirmed HH/HL or you don’t. This consistency helps newer traders develop structure recognition skills.
It also works across all currency pairs and timeframes without recalibration. The logic is universal—higher highs and higher lows define uptrends in both major pairs and exotics.
But here are the limitations nobody mentions enough: The indicator lags by design. By the time it confirms a swing, price has already moved. You won’t catch exact tops or bottoms. That’s the tradeoff for reliability.
It fails completely in ranging markets. When price oscillates between support and resistance without trending, you’ll get mixed signals—alternating HH/HL and LH/LL markers that don’t indicate directional edge. On pairs like NZD/USD during low-volatility European afternoons, this becomes obvious.
The indicator also can’t predict reversals. It tells you the trend structure that existed, not what’s coming next. When a strong uptrend finally reverses, the HHHL will eventually reflect this with LH/LL markers, but often after significant reversal movement has occurred.
Compared to moving average crossovers, this indicator provides earlier trend confirmation without the smoothing lag that moving averages introduce. But it doesn’t filter false breakouts as effectively as indicators that incorporate volume or momentum data.
Against Donchian Channels or ZigZag indicators, the HHHL is simpler and less prone to repainting issues (though this depends on the specific version you’re using—always verify with your developer).
How to Trade with Higher High Higher Low Indicator MT5
Buy Entry

- Wait for HH confirmation – Only enter long after the indicator marks a higher high above the previous swing high, typically 20-30 pips clear on EUR/USD 4-hour charts to avoid false breaks.
- Verify the higher low held – Confirm price bounced from a marked HL without breaking the previous swing low; this validates trend structure before committing capital.
- Enter on pullback completion – Place buy orders when price breaks above the pullback high after an HL forms, not during the pullback itself when direction remains uncertain.
- Set stop below the HL marker – Position your stop loss 10-15 pips beneath the confirmed higher low to protect against structure breakdown while giving the trade breathing room.
- Skip during ranging conditions – Avoid buy signals when price oscillates between the same highs and lows on daily GBP/USD charts without clear directional movement.
- Confirm with higher timeframe – Check that the 4-hour or daily chart shows HH/HL alignment before taking 1-hour buy signals to filter low-probability setups.
- Risk no more than 2% per trade – Calculate position size so a stop-loss hit equals maximum 2% of account balance, regardless of how strong the HH/HL pattern appears.
- Avoid major news releases – Don’t take buy entries within 30 minutes before high-impact news (NFP, interest rate decisions) as volatility invalidates swing structure rapidly.
Sell Entry

- Wait for LH confirmation – Enter short only after the indicator marks a lower high below the previous swing high, ensuring downtrend structure is forming on EUR/USD daily charts.
- Verify the lower low held – Confirm price dropped below the previous swing low and the indicator marked a LL before considering short positions.
- Enter on rally failure – Place sell orders when price breaks below the rally’s low after an LH forms, avoiding entries during the counter-trend bounce itself.
- Set stop above the LH marker – Position stops 10-15 pips above the confirmed lower high to protect against trend reversal while managing risk appropriately.
- Skip choppy London open – Avoid sell signals during the first 30 minutes of London session on GBP/USD 15-minute charts when whipsaw moves create false LH/LL patterns.
- Check for support levels nearby – Don’t take shorts if a major support zone sits 30-50 pips below entry on 4-hour charts; price may bounce before your target hits.
- Use 1:2 minimum risk-reward – Only take sell signals where potential profit (measured to next support) is at least twice your stop-loss distance.
- Ignore in strong uptrends – Skip LH/LL sell signals when the daily chart shows established HH/HL pattern; counter-trend shorts carry low probability and high risk.
Putting It All Together
The Higher High Higher Low indicator serves one purpose exceptionally well: confirming trend structure through objective swing point analysis. It marks when price creates valid HH/HL sequences in uptrends and LH/LL sequences in downtrends, removing subjective interpretation from structure assessment.
Traders benefit most when using this as a confirmation tool within a broader strategy. It won’t generate standalone signals or tell you when to enter and exit. But it will validate whether the trend structure supports your directional bias before you commit capital. That confirmation alone prevents countless bad trades in choppy or transitional markets.
The tool carries the same limitations as all lagging indicators—it reports what happened, not what will happen. It struggles in ranges and won’t catch reversals early. But for traders who build strategies around trending markets and swing structure, it offers exactly what they need: clear, consistent confirmation without the analysis paralysis that subjective swing marking creates.
Trading forex carries substantial risk. No indicator guarantees profits, and traders should never rely on any single tool for decision-making. Test thoroughly, combine with sound risk management, and remember that even the clearest trend structure can reverse without warning.
Recommended MT4/MT5 Broker
XM Broker
- Free $50 To Start Trading Instantly! (Withdraw-able Profit)
- Deposit Bonus up to $5,000
- Unlimited Loyalty Program
- Award Winning Forex Broker
- Additional Exclusive Bonuses Throughout The Year
- Exclusive 90% VIP Cash Rebates for all Trades!


Already an XM client but missing out on cashback? Open New Real Account and Enter this Partner Code: VIP90


