


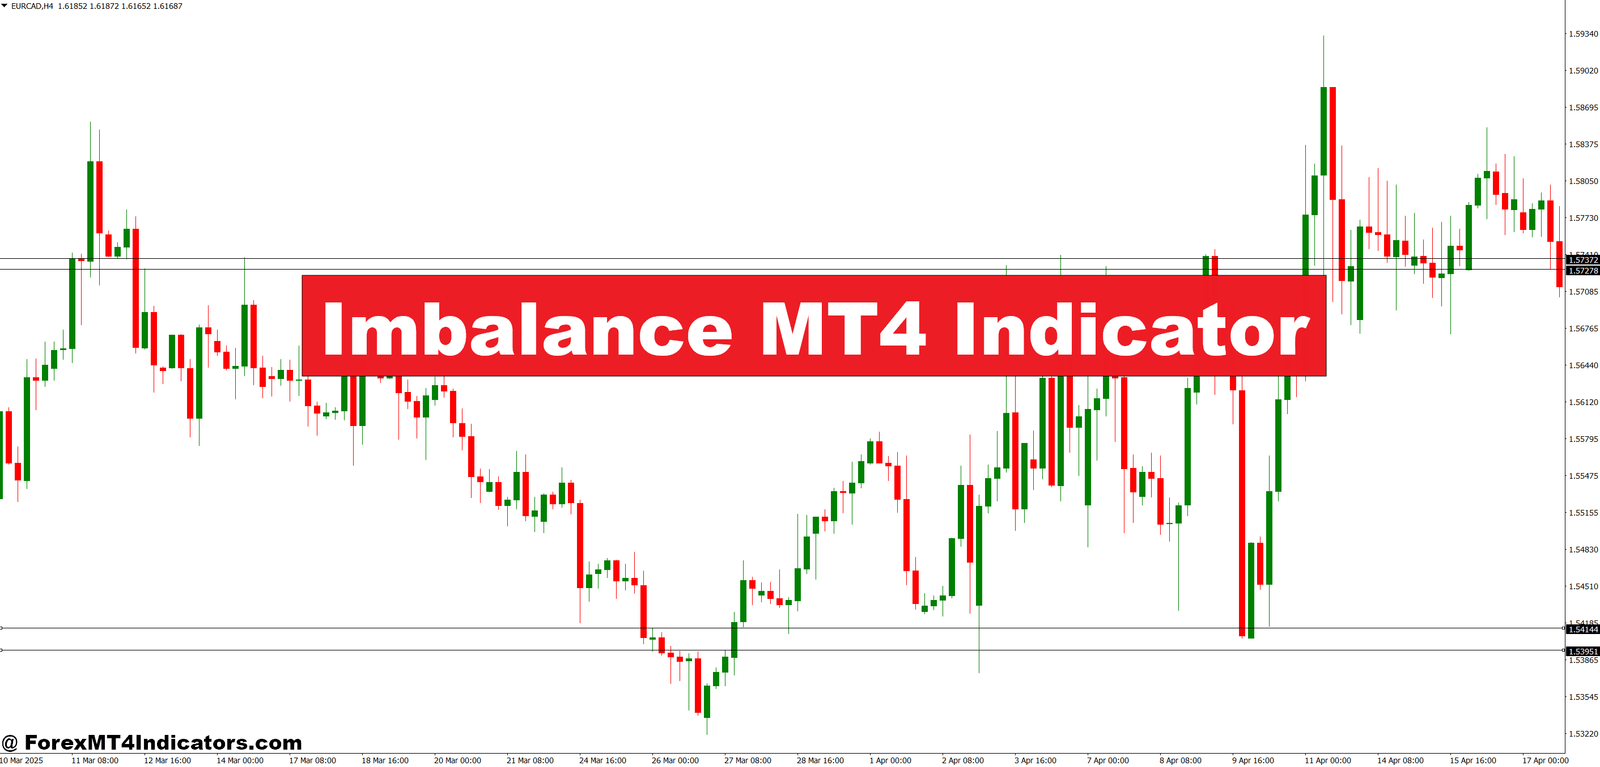

The Imbalance MT4 Indicator is a technical tool designed to identify inefficiencies in price movement. An imbalance forms when price moves strongly in one direction with little or no overlap between candles. This usually signals institutional order flow rather than retail noise.
On an MT4 chart, the indicator highlights these areas as zones or blocks. They often appear after sharp impulsive moves. Traders treat them as potential future reaction points, similar to supply and demand zones but more precise in structure.
Unlike lagging indicators that rely on averages, this tool reads raw price behavior. It focuses on how candles are built, not how indicators smooth them. That’s why many price action traders pair it with clean charts rather than stacking oscillators.
But here’s the thing. An imbalance is not a trade by itself. It’s a context tool. Traders still need confirmation from structure, trend, or session timing to stay out of chop.
How the Indicator Works Behind the Scenes

The logic is rooted in candle relationships. Most Imbalance MT4 Indicators scan for a three-candle pattern. The middle candle shows strong momentum, while the candles before and after leave a price gap or minimal overlap.
For example, if EUR/USD prints a strong bullish candle on the 1-hour chart, and the previous candle’s high doesn’t overlap much with the next candle’s low, an imbalance forms. That suggests buyers were aggressive and sellers couldn’t fill orders efficiently.
The indicator marks this price range as an imbalance zone. When price returns later, it often reacts because unfilled orders still sit there. That’s the theory institutions trade around.
During testing on volatile NFP days, traders often notice clean imbalances forming right after the news spike. Price may revisit those zones hours or even days later, especially on higher timeframes like H1 or H4.
Still, not every imbalance gets respected. In strong trends, price may slice through them without hesitation. Context always matters.
Practical Trading Applications With Real Examples
Traders use the Imbalance MT4 Indicator in several ways, depending on style and timeframe.
One common setup appears on EUR/USD, 1-hour chart, London session. Price breaks above Asian range with a strong bullish impulse, leaving a visible imbalance between 1.0840 and 1.0852. Instead of buying the breakout, traders wait. Hours later, price pulls back into that zone. A bullish engulfing candle forms at 1.0845. Entry triggers with a stop 15 pips below. Target sits at previous high, offering a 1:3 risk-to-reward.
On lower timeframes, like GBP/USD M15, imbalances help avoid whipsaw. During New York chop, price often fakes breaks. Traders mark fresh imbalances aligned with the H1 trend and ignore counter-trend zones. That filter alone cuts down bad trades.
Scalpers sometimes use the tool on M5, but spreads and execution matter more there. The indicator works best when paired with session highs, lows, and structure.
Settings, Customization, and Best Use

Most Imbalance MT4 Indicators allow traders to adjust sensitivity. Common parameters include minimum candle size, number of candles used in detection, and whether to show filled zones.
For higher timeframes like H4 or D1, traders often increase the minimum candle size. This filters out minor noise and keeps zones clean. On M15 or M30, lowering that value helps capture intraday moves.
Some traders color-code imbalances. Bullish zones might appear blue, bearish zones red. Others hide filled imbalances to reduce clutter. That’s useful when backtesting months of data.
Currency pair choice matters too. Pairs like EUR/USD and USD/JPY respect imbalances more cleanly than exotic pairs, which tend to spike and ignore structure.
But customization won’t fix poor discipline. Traders still need to wait for price to come to the zone. Chasing defeats the purpose.
Advantages, Limitations, and Comparison With Similar Tools
The biggest advantage of the Imbalance MT4 Indicator is clarity. It shows where price moved with intent, not hesitation. That helps traders plan trades instead of reacting late.
It also pairs well with support and resistance, trendlines, and market structure. Compared to RSI or MACD, it doesn’t lag. It reacts to what price already did.
That said, it has limits. In ranging markets, imbalances form and fail often. During low-liquidity sessions, zones may look clean but mean little. And on strong news-driven trends, price may never return to an imbalance.
Compared to supply and demand indicators, imbalance zones are usually tighter. Compared to fair value gap tools, they’re similar, though some versions calculate gaps differently. The core idea remains price inefficiency.
Trading forex carries substantial risk. No indicator guarantees profits. Losses are part of the process, even with solid tools.
How to Trade with Imbalance MT4 Indicator
Buy Entry

- Mark a fresh bullish imbalance zone – Identify a clean imbalance after a strong bullish impulse on EUR/USD 1-hour or 4-hour chart; avoid zones older than 2–3 days.
- Wait for price to retrace into the zone – Let price pull back at least 50–100% into the imbalance; chasing the first breakout often leads to fake-outs.
- Confirm with bullish candle close – Enter only after a bullish engulfing or strong close above the zone on H1; this shows buyers are defending it.
- Align with higher-timeframe trend – Take buys only if the 4-hour or daily trend is bullish; counter-trend imbalances fail more often.
- Place stop-loss below the zone – Set stop 10–20 pips below the imbalance on H1, or below structure low to avoid random wicks.
- Target recent highs or next imbalance – Aim for 1:2 or 1:3 risk-to-reward, such as 30–60 pips on EUR/USD.
- Reduce size during news sessions – On NFP or CPI days, cut risk by 50% or skip the trade; volatility can ignore zones.
Sell Entry

- Identify a bearish imbalance after a drop – Look for sharp sell-offs on GBP/USD H1 or H4 that leave a clear imbalance above price.
- Wait for pullback into resistance – Let price retrace into the imbalance near prior highs; selling too early increases drawdown.
- Confirm with bearish rejection – Enter after a bearish engulfing or strong close below the zone; wicks alone aren’t enough.
- Trade with higher-timeframe bias – Favor sells when daily or 4-hour structure shows lower highs and lower lows.
- Place stop-loss above imbalance – Keep stops 10–25 pips above the zone on H1 to protect against stop hunts.
- Set targets at prior lows – Use recent support or the next imbalance below as target, aiming for at least 1:2 R:R.
- Avoid ranging markets – Don’t sell imbalances in tight 20–30 pip ranges; price will chop and invalidate clean setups.
Conclusion
The Imbalance MT4 Indicator gives traders a structured way to read aggressive price moves and plan smarter entries.
- It highlights where institutions likely left unfilled orders
- It works best when aligned with trend, structure, and session timing
- It’s a context tool, not a signal generator on its own
Used correctly, it can reduce chasing and emotional trades. But it won’t fix poor risk management or impatience. Traders who test it across pairs and timeframes, log results, and stay selective tend to get the most value. The real edge comes from how the indicator fits into a broader trading plan, not from the zones alone.
Recommended MT4/MT5 Broker
XM Broker
- Free $50 To Start Trading Instantly! (Withdraw-able Profit)
- Deposit Bonus up to $5,000
- Unlimited Loyalty Program
- Award Winning Forex Broker
- Additional Exclusive Bonuses Throughout The Year
- Exclusive 90% VIP Cash Rebates for all Trades!


Already an XM client but missing out on cashback? Open New Real Account and Enter this Partner Code: VIP90


