







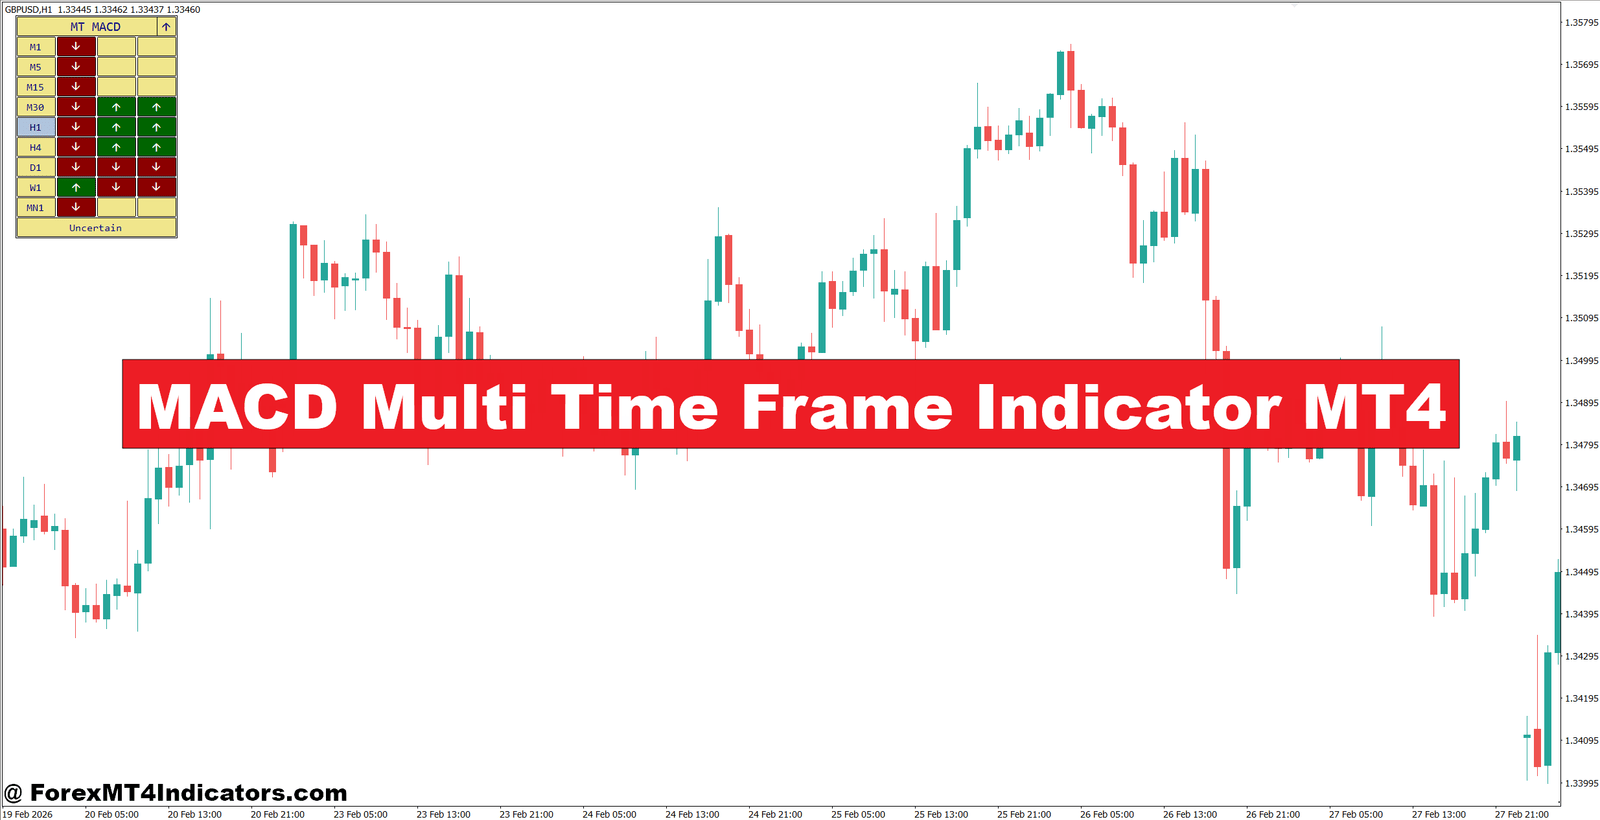
The MACD Multi Time Frame Indicator MT4 is a modified version of the standard Moving Average Convergence Divergence indicator. Its main difference is that it can display MACD information from several timeframes while the trader remains on one selected chart.
Traditional MACD uses two exponential moving averages:
MACD Line = 12-period EMA − 26-period EMA
A 9-period EMA of the MACD line forms the signal line. The difference between those two lines creates the histogram.
The multi-timeframe version applies this same basic MACD logic to different chart periods. For example, a trader working on the 15-minute chart may check the 15-minute, 1-hour, and 4-hour MACD conditions at the same time.
This matters because momentum can disagree across timeframes. A bullish 15-minute crossover doesn’t automatically mean the 4-hour trend has turned bullish.
Why Multiple Timeframes Matter
Suppose EUR/USD is trading near 1.0850. The 15-minute MACD crosses above its signal line, suggesting short-term buying pressure. However, the 4-hour MACD remains below its signal line and price sits below a recent resistance zone around 1.0880.
A trader who only watches M15 may buy too early.
A trader who checks the higher timeframe may wait for stronger confirmation instead. That small delay can prevent a trade from being taken directly into resistance.
How the Indicator Works in Real Trading
The most useful way to read a multi-timeframe MACD is to treat it as a trend and momentum filter, not as a standalone entry system.
For a bullish setup, traders generally want the higher timeframe to support the direction of the lower timeframe. For example, a trader might use the 4-hour chart to identify the broad trend, H1 for confirmation, and M15 for the actual entry.
Consider GBP/USD during a strong upward move. On the H4 chart, MACD remains above the signal line and the histogram stays positive. Price also forms higher highs and higher lows. Later, the H1 MACD dips below its signal line during a pullback.
That H1 weakness doesn’t necessarily mean the trend has reversed. If the M15 MACD turns bullish again near an H1 support level, the setup may offer a more controlled entry.
A practical entry could be around 1.2760, with a stop near 1.2735. That gives roughly 25 pips of initial risk. If the next resistance zone sits around 1.2820, the potential reward is about 60 pips, producing a risk-to-reward ratio close to 1:2.4.
But the trade still needs price confirmation. A MACD crossover by itself isn’t enough.
Settings and Timeframe Combinations
The standard MACD settings of 12, 26, and 9 are a reasonable starting point. Traders should avoid changing these numbers simply because a backtest looks better on one pair.
For intraday forex trading, a three-timeframe structure can work well:
- Higher timeframe: H4 for the main trend
- Middle timeframe: H1 for market structure and momentum
- Entry timeframe: M15 for timing
A faster trader could use H1, M15, and M5. However, lower timeframes produce more market noise. Spread costs and short-term volatility also become more important.
For EUR/USD, the standard settings can often provide a clean starting point because the pair usually has strong liquidity. GBP/JPY may require more patience because its larger intraday swings can produce sharp MACD changes.
During volatile NFP sessions, for example, MACD crossovers can appear and disappear within a few candles. A trader testing the indicator during those periods should avoid treating every crossover as a genuine trend change.
One practical adjustment is to use wider stops during high-volatility periods rather than simply increasing the lot size. Risking around 0.5% to 1% of account equity per trade gives the setup room to develop without putting too much capital at risk.
MACD Multi Time Frame Indicator vs Standard MACD

Standard MACD works well when the trader wants to study momentum on one timeframe. Its weakness is that the trader must manually switch between charts to compare larger and smaller trends.
The multi-timeframe version makes that comparison easier.
Compared with RSI, MACD provides a stronger view of moving-average momentum and trend changes. RSI can show overbought and oversold conditions, but an RSI reading above 70 doesn’t automatically mean price should fall.
Compared with moving averages alone, MACD provides information about the relationship between short- and longer-term momentum. Moving averages can confirm direction, while MACD crossovers and histogram changes can help identify shifts in momentum.
That said, MACD tends to lag because it relies on moving averages. A sharp reversal can already be underway before the indicator confirms it.
Price action remains important.
For instance, if USD/JPY produces a bearish MACD reading on H1 but price is sitting directly above a well-tested support level at 151.20, blindly selling may be poor trade management. A break below support followed by a retest could provide better confirmation.
Advantages and Limitations
One major advantage is simplicity. Traders can quickly compare several timeframes without constantly changing charts. It can also help reduce trades taken against the larger trend.
Another benefit is confirmation. When H4, H1, and M15 momentum point in the same direction, the setup has more technical agreement than an isolated M15 crossover.
The limitations are just as important. MACD is a lagging tool, and multiple-timeframe readings don’t eliminate false signals. Strong news events can also cause rapid reversals that make momentum indicators unreliable for short periods.
A common mistake is waiting for every timeframe to turn bullish before entering. By then, much of the move may already be gone. The goal isn’t perfect agreement. It’s to find a reasonable balance between trend direction, price structure, and entry timing.
A Practical Trading Routine
A simple routine can make the indicator easier to use.
First, traders can check H4 to determine whether price is making higher highs, lower lows, or moving sideways. Next, H1 can be used to locate support and resistance and check whether momentum agrees with the broader trend.
Finally, M15 can provide the entry trigger.
For a potential buy, a trader might look for H4 bullish momentum, H1 support holding, and an M15 MACD bullish crossover after a pullback. A bearish setup can use the opposite conditions.
For example, if EUR/USD breaks above 1.0900, pulls back toward 1.0880, and M15 MACD turns bullish while H1 remains positive, a trader could consider an entry after a bullish candle closes. A stop might sit 15–25 pips below the structure, depending on volatility, while the first target could be 30–50 pips away.
If the market is chopping sideways and MACD keeps crossing around the zero line, it’s often better to stand aside. Chop is where many crossover strategies get damaged.
How to Trade with MACD Multi Time Frame Indicator MT4
Buy Entry
- Confirm H4 bullish momentum – Take BUY setups when the 4-hour MACD stays above its signal line and price forms higher highs.
- Check H1 direction – Prefer entries when the 1-hour MACD also turns bullish, especially after a pullback toward support.
- Wait for M15 crossover – Enter after a bullish MACD crossover on the 15-minute chart instead of buying during a sharp candle.
- Use support for confirmation – On EUR/USD, look for price to hold a support zone and place the stop around 15–25 pips below it.
- Check the daily trend – Avoid aggressive BUY trades when the daily MACD is strongly bearish against the H4 setup.
- Target at least 1:2 R – If the stop is 20 pips, aim for approximately 40 pips or more toward the next resistance.
- Risk only 0.5–1% – Keep position risk near 0.5% to 1% per trade, even when H4, H1, and M15 signals agree.
- Avoid major-news entries – Don’t enter GBP/USD immediately before NFP, CPI, or central-bank announcements because MACD can whipsaw quickly.
Sell Entry
- Confirm H4 bearish momentum – Look for the 4-hour MACD below its signal line while price creates lower highs and lower lows.
- Check H1 confirmation – Favor SELL trades when the 1-hour MACD remains bearish after price rejects a resistance zone.
- Wait for M15 crossover – Use a bearish 15-minute MACD crossover as the entry trigger after the higher timeframes agree.
- Sell near resistance – On GBP/USD, consider a rejection from resistance and place the stop roughly 20–30 pips above the structure.
- Respect the daily trend – Avoid strong SELL positions when the daily MACD remains clearly bullish and price holds major support.
- Aim for 1:2 reward – With a 25-pip stop, look for roughly 50 pips of potential profit before entering.
- Limit account exposure – Risk around 0.5–1% per trade rather than increasing lot size after a losing signal.
- Skip sideways conditions – Don’t sell when MACD repeatedly crosses around the zero line on H1 and H4; this often signals market chop.
Conclusion
The MACD Multi Time Frame Indicator MT4 can give traders a cleaner way to compare momentum across several chart periods. Its practical value comes from combining higher-timeframe direction with lower-timeframe timing rather than chasing every crossover.
- Use higher timeframes for direction – H4 or H1 can provide broader trend context.
- Use lower timeframes for entries – M15 or M5 can help refine trade timing.
- Confirm with price structure – Support, resistance, breakouts, and pullbacks should support the MACD reading.
- Control risk first – A good signal can still fail, so position sizing and stop placement matter.
The MACD Multi Time Frame Indicator MT4 works best as part of a wider trading process, not as an automatic buy or sell machine. Traders who combine it with market structure and disciplined risk management are better positioned to judge when a signal deserves attention.
Trading forex carries substantial risk. No indicator guarantees profits. Before using real money, traders should test the settings on their preferred pairs, review historical conditions, and practice the method on a demo account.
Recommended MT4/MT5 Broker
XM Broker
- *FREE $50 To Start Trading Instantly! (Withdraw-able Profit)
- Deposit Bonus up to $5,000
- Unlimited Loyalty Program
- Award Winning Forex Broker
- Additional Exclusive Bonuses Throughout The Year


>> Sign Up for XM Broker Account here <<
(Free MT4 Indicators Download)


