


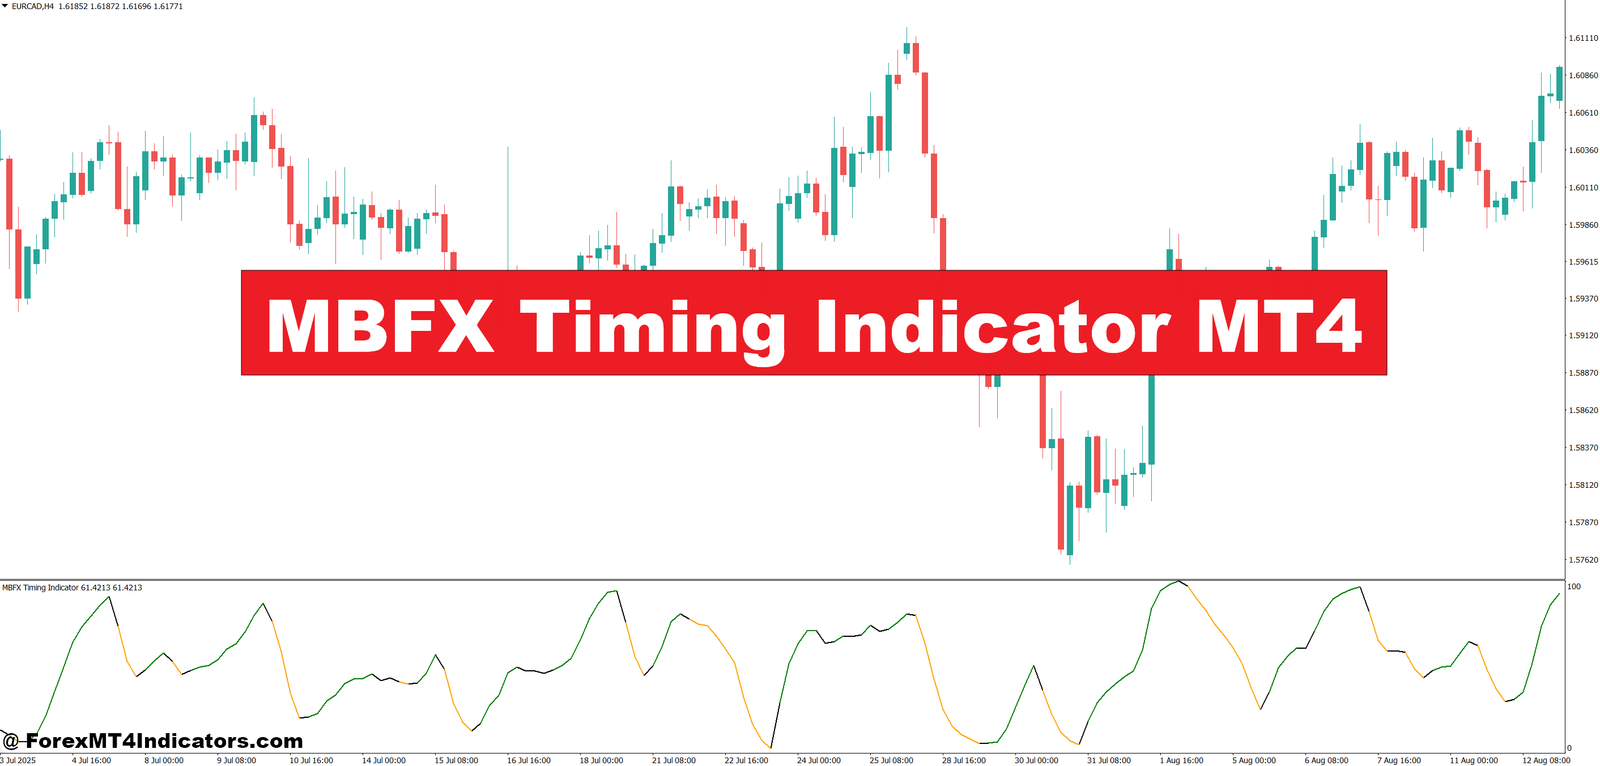
The MBFX Timing Indicator MT4 is a momentum-based technical tool used to identify potential reversal points in the market. It plots a colored line or dots near price extremes, often at the top or bottom of the chart window. Traders treat these signals as alerts for possible buy or sell opportunities, not as automatic trade commands.
At its core, the indicator blends concepts from oscillators and price smoothing. It reacts faster than classic tools like the 14-period RSI but slower than raw price action. This balance makes it useful for timing entries after price reaches short-term exhaustion.
Many traders use it as a confirmation tool rather than a standalone system. On its own, it can give frequent signals during chop. When aligned with trend direction or support and resistance, it becomes far more reliable.
How It Works: Logic and Calculation Explained
The MBFX Timing Indicator MT4 relies on smoothed price data to detect momentum shifts. While the exact formula varies by version, most implementations use a form of moving average filtering combined with overbought and oversold thresholds. When price momentum weakens near an extreme, the indicator changes color or position.
For example, when bullish momentum fades near a local high, the indicator may flip to a bearish color above price. That suggests buyers are losing control. The opposite happens near market lows, where selling pressure slows and the indicator signals a potential upward move.
In practice, this logic works best after extended moves. During testing on volatile NFP days, traders often notice cleaner signals on the 15-minute and 30-minute charts once the initial news spike settles. During low-liquidity Asian sessions, signals tend to cluster and require extra filtering.
Practical Trading Applications

Traders often apply the MBFX Timing Indicator MT4 on intraday charts. One common setup uses the EUR/USD on the 1-hour timeframe. Suppose price has been trending upward and pulls back into a known support zone around 1.0850. When the indicator flips from bearish to bullish near that level, traders look for bullish candles to confirm entry.
Another example comes from GBP/JPY on the 15-minute chart. This pair is known for sharp moves and fake-outs. When price spikes into resistance during London open and the indicator prints a sell signal, experienced traders wait for the next candle close below minor structure. That extra step filters many bad trades.
But don’t ignore market conditions. In strong trends, countertrend signals often fail. Many traders only take signals in the direction of the higher timeframe trend, such as aligning a 15-minute entry with a 4-hour structure.
Settings, Customization, and Trader Preferences

Most versions of the MBFX Timing Indicator MT4 include adjustable parameters like period length and sensitivity. Lower period values increase responsiveness but also raise the risk of noise. Higher values smooth signals but introduce delay.
Scalpers trading EUR/USD or USD/JPY often use tighter settings on the 5-minute chart. Swing traders on the 1-hour or 4-hour charts prefer slower settings to avoid reacting to every minor pullback. A common approach is testing settings during sideways markets first, where weaknesses show quickly.
Experienced traders also pair it with a trend filter. A 50-period or 200-period moving average works well. If price stays above the moving average, only buy signals from the indicator are considered. That simple rule cuts many losing trades.
Advantages, Limitations, and Honest Trade-Offs
The main advantage of the MBFX Timing Indicator MT4 is clarity. Signals are easy to spot, even for traders who struggle with complex oscillators. It also reacts faster than many momentum tools, which helps with precise entries.
But there are limits. In choppy markets, signals can stack up and lead to overtrading. The indicator doesn’t measure volatility, so sudden spikes can trigger misleading flips. Traders who ignore context often blame the tool instead of their execution.
Compared with indicators like RSI or Stochastic, MBFX focuses more on timing than condition measurement. RSI shows strength levels; MBFX hints at when that strength may shift. Used together, they complement each other well.
Trading forex carries substantial risk. No indicator guarantees profits. Losses are part of the process, and risk management matters more than signal accuracy.
How to Trade with MBFX Timing Indicator MT4
Buy Entry

- Indicator flips to buy below price – Enter when the MBFX line turns bullish under the candle on the 1-hour chart, ideally after a 30–50 pip pullback on EUR/USD. This shows selling pressure is fading.
- Signal aligns with higher timeframe trend – Take buys only if the 4-hour trend is bullish, such as price holding above the 200-EMA. This avoids fighting strong downside momentum.
- Buy near a clear support zone – Look for a buy signal within 10–15 pips of daily or 4-hour support. These levels increase the chance of a reaction.
- Confirm with candle close – Wait for the candle to close bullish after the signal. Entering early often leads to fake-outs during London or New York opens.
- RSI above 40 supports entry – If the 14-period RSI stays above 40 on the 1-hour chart, momentum still favors buyers.
- Risk stays under 1–2% per trade – Place stop loss 15–25 pips below the recent swing low and size the position so one loss won’t hurt the account.
- Avoid high-impact news – Don’t take buy signals 30 minutes before major USD or GBP news. Spikes can flip the indicator quickly.
Sell Entry

- Indicator flips to sell above price – Enter when the MBFX line turns bearish above the candle on GBP/USD 1-hour chart after a 40–60 pip rally. This signals buyer exhaustion.
- Trade with bearish higher timeframe bias – Take sells only if the 4-hour or daily trend is down, such as price staying below the 100-EMA.
- Sell near resistance or supply zone – Strong sell setups form within 10–20 pips of previous highs or daily resistance levels.
- Wait for bearish candle confirmation – A strong bearish close after the signal helps avoid whipsaws in ranging markets.
- MACD below zero adds confidence – If MACD stays below the zero line on the 1-hour chart, downside momentum supports the trade.
- Keep stops tight and logical – Place stop loss 20–30 pips above the recent swing high and target at least a 1:1.5 risk-to-reward.
- Skip signals in low-range markets – When the daily range is under 50 pips, MBFX signals lose reliability and often cause chop.
Conclusion
The MBFX Timing Indicator MT4 offers traders a visual way to spot potential momentum shifts without drowning in data. It helps highlight entry timing, especially near support and resistance zones, when price shows signs of exhaustion. Traders who combine it with trend confirmation and disciplined risk rules tend to see better results. It works best as part of a broader technical analysis method, not as a shortcut to profits.
Used with patience, this indicator can sharpen entries and reduce emotional trades. But its value depends on context, testing, and execution. The next step is simple: apply it on a demo account, log real examples across different pairs, and see how it behaves in your trading style.
Recommended MT4/MT5 Broker
XM Broker
- Free $50 To Start Trading Instantly! (Withdraw-able Profit)
- Deposit Bonus up to $5,000
- Unlimited Loyalty Program
- Award Winning Forex Broker
- Additional Exclusive Bonuses Throughout The Year
- Exclusive 90% VIP Cash Rebates for all Trades!


Already an XM client but missing out on cashback? Open New Real Account and Enter this Partner Code: VIP90


