


The MT4 ADR Indicator offers a practical way to fix that. It shows the Average Daily Range directly on the chart, helping traders judge when a move still has room and when it’s likely running out of steam. Instead of guessing, traders get context. That context often makes the difference between a clean exit and a frustrating fake-out. Let’s break down how it works and how traders actually use it in live markets.
What the MT4 ADR Indicator Is
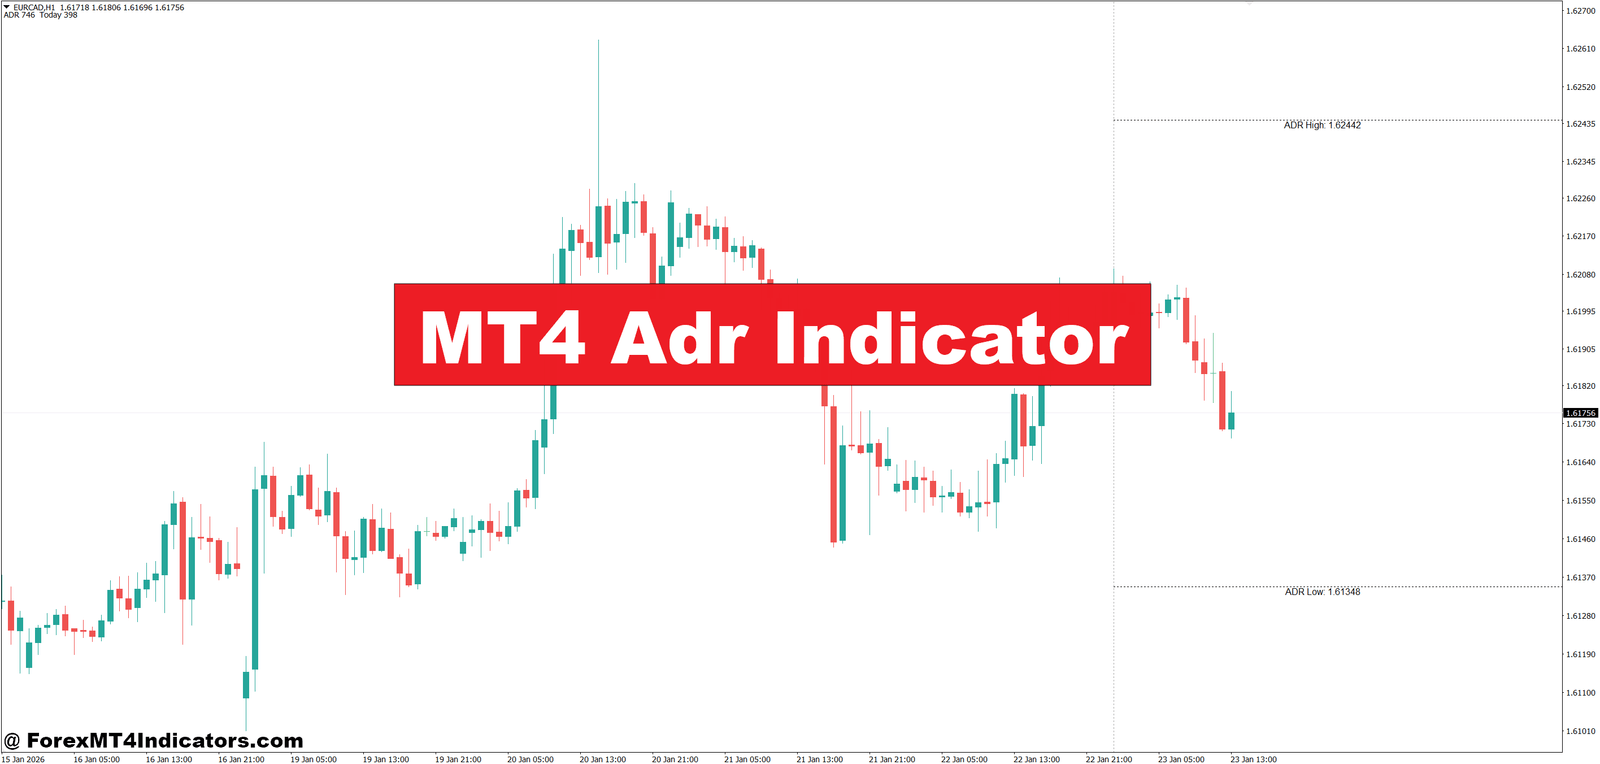
The MT4 ADR Indicator is a technical tool that measures how many pips a currency pair moves per day, on average, over a defined period. Most versions calculate ADR using the last 5, 10, or 20 trading days. The result is displayed as a number, horizontal levels, or a projected high–low range for the current day.
Unlike trend indicators, it doesn’t predict direction. Instead, it provides boundaries. Traders often treat these boundaries as “probable limits” for daily price movement. When EUR/USD has an ADR of 85 pips, history suggests that most days won’t exceed that range by much.
In practice, this makes the indicator a context tool. It works best when combined with price action, support and resistance, or momentum indicators. On its own, it won’t tell traders to buy or sell. But it tells them whether chasing a move makes sense.
How the MT4 ADR Indicator Works

The logic behind ADR is simple but effective. The indicator calculates the difference between each day’s high and low, then averages those values over a selected number of days.
For example:
- Day 1 range: 92 pips
- Day 2 range: 78 pips
- Day 3 range: 85 pips
If the lookback period is 3 days, the ADR would be around 85 pips. Most MT4 ADR indicators then project this value onto the current trading day, starting from the daily open.
Some versions plot:
- ADR High level
- ADR Low level
- Percentage markers (50%, 75%, 100%)
When testing this on volatile NFP days, traders often notice price reaches 120–140% of ADR, but those moves usually fade fast. On quiet Asian sessions, price may only cover 30–40% of the ADR before stalling.
That’s the edge. The indicator doesn’t react late. It sets expectations early in the day.
Practical Trading Applications
One common use is trade management. Suppose EUR/USD on the 1-hour chart has an ADR of 90 pips. Price has already moved 75 pips from the daily open and is approaching a prior resistance zone. A breakout buy might look tempting. But ADR suggests limited room left.
Experienced traders often scale out or tighten stops near 80–90% ADR. They don’t expect miracles late in the day.
Another setup involves reversals. On GBP/JPY during London session, price hits 100% ADR near a weekly resistance level. The 15-minute chart shows long upper wicks and slowing momentum. That’s where countertrend traders start watching for short entries with tight risk.
ADR also helps with stop-loss placement. If USD/JPY typically moves 70 pips a day, placing a 60-pip stop on an intraday trade rarely makes sense. It’s too wide for the pair’s behavior.
And yes, it helps avoid chop. When price has covered only 20% ADR by New York open, traders know the day may stay slow unless news hits.
Settings and Customization

Most traders stick with a 10 or 14-day ADR setting. Shorter periods react faster but can overstate volatility after news-heavy weeks. Longer periods smooth things out but lag during regime shifts.
Pair behavior matters:
- EUR/USD: 10–14 days works well
- GBP pairs: 14–20 days often feel more stable
- JPY crosses: adjust based on session volatility
Timeframe doesn’t change ADR calculation, but how traders use it does. Scalpers on M5 charts watch ADR percentages closely. Swing traders on H4 or D1 mainly use ADR to set realistic profit targets.
Some MT4 ADR indicators allow session-based calculations. That’s useful for traders who only trade London or New York. But those settings need testing before relying on them.
Advantages, Limitations, and Comparisons
The biggest advantage is clarity. The MT4 ADR Indicator helps traders stop overexpecting. It aligns targets with market reality.
It also pairs well with tools like RSI, moving averages, and support/resistance. When multiple signals align near ADR extremes, trade decisions feel cleaner.
But it has limits. ADR doesn’t account for sudden news spikes. CPI or central bank decisions can blow past ADR levels without warning. That’s why traders avoid using it as a hard ceiling.
Compared to ATR (Average True Range), ADR focuses strictly on daily movement. ATR adapts faster and works better for stop sizing. ADR works better for daily context and target planning. Many experienced traders use both.
Pivot points offer fixed levels. ADR levels adjust with volatility. That’s why ADR often feels more “alive” during changing market conditions.
How to Trade with MT4 Adr Indicator
Buy Entry

- Price holds above daily open – Look for EUR/USD on the 1-hour chart staying above the daily open while only 30–50% of ADR (for example, 25–40 pips out of a 80-pip ADR) is completed, which suggests room for continuation.
- Pullback near support before 60% ADR – Enter buy trades when price pulls back to a clear support zone or 20–50 EMA and ADR usage is still below 60%, avoiding late entries.
- Bullish candle at ADR midpoint – A strong bullish close near the 50% ADR level on GBP/USD H1 often signals momentum continuation toward 80–90% ADR.
- London session expansion – Buy during early London hours if the pair has moved less than 40% ADR and volume starts increasing, which often leads to directional moves.
- Higher-timeframe trend alignment – Take buys on H1 only when the H4 or daily trend is bullish and current price is below 70% ADR.
- Tight stop below structure – Place stops 10–20 pips below recent support or swing low, not beyond full ADR, to keep risk controlled.
- Avoid buys near full ADR – Don’t buy if price has already hit 90–100% ADR, as upside is usually limited and fake-outs are common.
Sell Entry

- Price rejects ADR high zone – Sell when EUR/USD reaches 80–100% ADR and shows rejection wicks on the 1-hour chart, signaling exhaustion.
- Bearish close near resistance – A strong bearish candle closing below resistance while ADR usage is above 70% often favors short setups.
- Failed breakout after full ADR – Enter sells if GBP/USD breaks above resistance after 100% ADR but quickly closes back inside the range.
- New York session reversal – Look for sells late in New York if London already completed most of the ADR and momentum starts fading.
- Lower-timeframe confirmation – Use M15 or H1 bearish structure breaks when the daily ADR is nearly completed to time entries.
- Stop above ADR extreme – Keep stops 10–25 pips above the ADR high to protect against sudden spikes, especially on news days.
- Skip sells early in the day – Avoid selling when less than 40% ADR is covered and the higher timeframe trend is bullish, as downside may be limited.
Conclusion
The MT4 ADR Indicator gives traders something many charts lack perspective. It doesn’t tell traders what to think, but it shows what’s realistic.
Traders often take away three key lessons. First, not every move is worth chasing, especially near full ADR. Second, exits improve when targets respect average daily behavior. Third, combining ADR with price action reduces emotional trades during chop.
Used properly, this indicator supports better decisions, not perfect ones. Trading forex carries substantial risk. No indicator guarantees profits. But tools that help manage expectations often protect capital better than flashy signals.
For traders refining intraday strategies, the next step is simple: track ADR percentages for a few weeks and compare them with trade outcomes. The patterns tend to speak for themselves.
Recommended MT4/MT5 Broker
XM Broker
- Free $50 To Start Trading Instantly! (Withdraw-able Profit)
- Deposit Bonus up to $5,000
- Unlimited Loyalty Program
- Award Winning Forex Broker
- Additional Exclusive Bonuses Throughout The Year
- Exclusive 90% VIP Cash Rebates for all Trades!


Already an XM client but missing out on cashback? Open New Real Account and Enter this Partner Code: VIP90


