


MT4 signal indicators address this specific challenge by providing clear, objective entry and exit signals based on predetermined criteria. These tools analyze price action, momentum, and trend conditions to generate visual alerts when specific market conditions align. Instead of wrestling with subjective interpretation, traders get actionable signals that remove the guesswork from timing decisions.
What MT4 Signal Indicators Actually Do
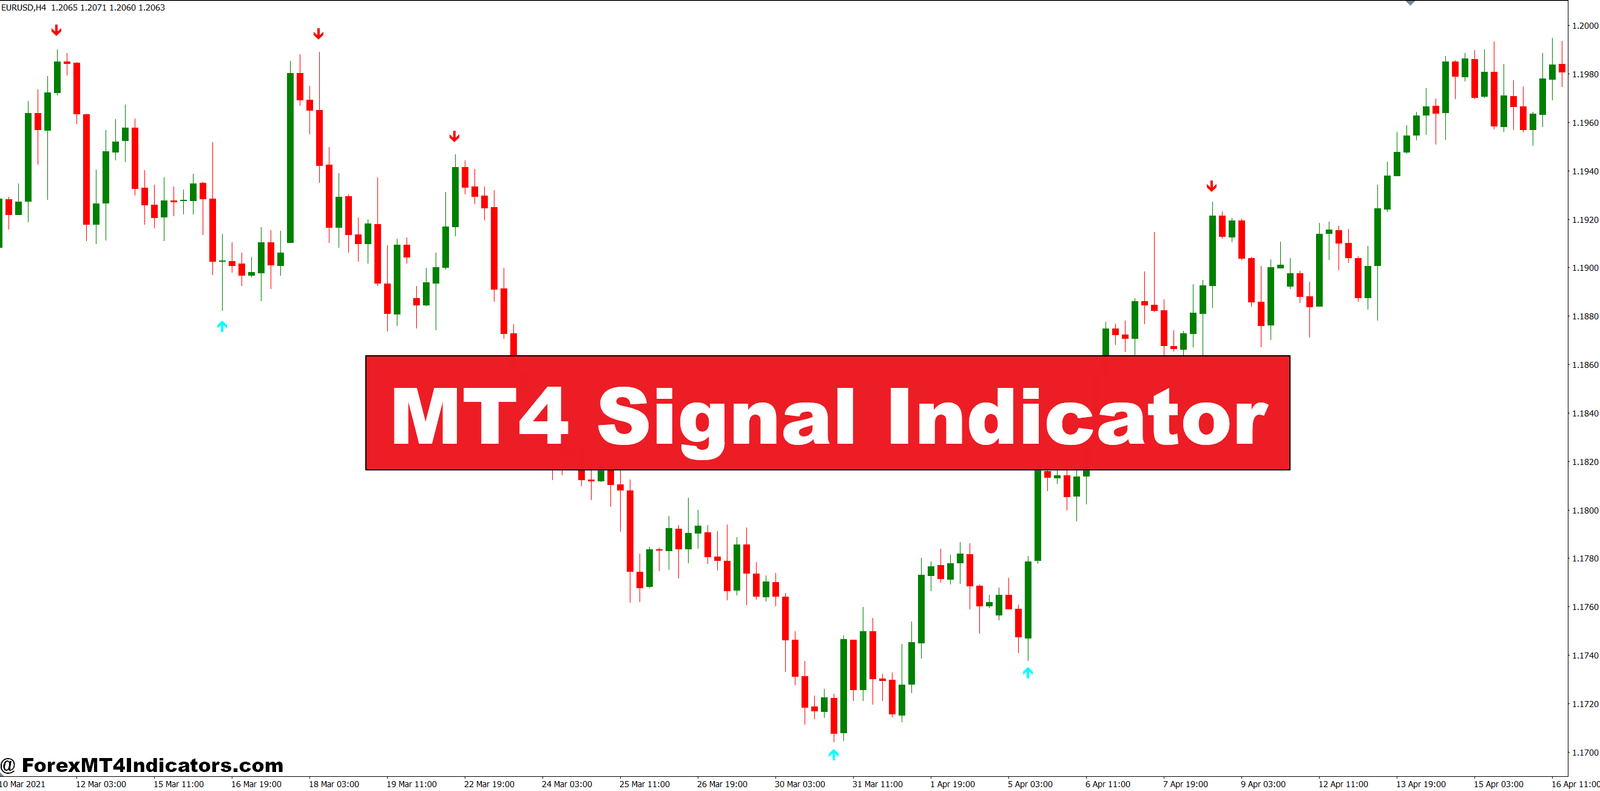
An MT4 signal indicator is a technical analysis tool that runs on the MetaTrader 4 platform, scanning price data to identify potential trading opportunities. These indicators process mathematical calculations on historical price movements and output visual signals—typically arrows, dots, or pop-up alerts—when conditions meet specific thresholds.
The signals can be based on various methodologies. Some track moving average crossovers, others monitor oscillator readings, and many combine multiple conditions to filter out weak setups. A simple signal indicator might flash a buy arrow when the 50-period moving average crosses above the 200-period moving average. More complex versions might require RSI readings above 50, price above both EMAs, and MACD showing bullish momentum before triggering an alert.
What separates these from standard indicators is the actionable output. While a regular RSI shows numerical readings that require interpretation, a signal indicator processes that data and tells traders when to act. It’s the difference between reading a thermometer and having an alarm that sounds when temperature hits a specific level.
How Signal Indicators Process Market Data

The calculation method varies by indicator type. Trend-following signal indicators typically use moving average relationships. When a faster MA crosses above a slower MA, the indicator registers a bullish condition. Add a slope requirement—say the slow MA must be angling upward for at least 5 bars—and the filter becomes more selective.
Momentum-based signals incorporate oscillators. An indicator might require RSI above 50 and rising, Stochastic in bullish territory but not overbought, and CCI showing positive momentum. Only when all three conditions align does the signal fire.
Here’s the thing: the logic chain matters more than any single component. A trader testing signal indicators on GBP/JPY 15-minute charts during London session discovered that adding a simple volume filter—requiring current volume to exceed the 20-bar average—reduced false signals by roughly 40%. That one modification transformed a mediocre tool into a reliable entry system.
The best signal indicators build in confirmation delays. Instead of flashing an arrow the instant conditions meet, they wait for the candle to close. This prevents premature signals that disappear when price reverses before the period ends. It’s a small detail that dramatically improves signal reliability.
Real Trading Applications and Examples
Consider a scalping scenario on EUR/USD during the New York session. A trader uses a signal indicator that combines three elements: price position relative to 20 EMA, MACD histogram color, and ADX reading above 20 to confirm trending conditions. On a typical Wednesday afternoon, the indicator fires a buy signal at 1.0850 when all conditions align.
The trade develops according to plan. Price rides the 20 EMA upward, adding 35 pips before the indicator flashes an exit signal when MACD histogram turns negative. The entire position lasted 90 minutes. No guesswork, no emotional override—just follow the signals.
But not every signal works. That same indicator fired three more signals that afternoon. One got stopped out for a 15-pip loss when price whipsawed around a news release. Another scratched even when the move stalled immediately after entry. The third captured another 28 pips before the session ended.
This is typical performance for signal indicators. They don’t catch every move perfectly, and they generate occasional losing trades. The edge comes from consistency and removing emotional interference. Four signals: two winners totaling 63 pips, one small loss, one breakeven. The system worked because the trader followed every signal without cherry-picking.
Customization and Parameter Adjustment

Signal indicators typically offer multiple adjustable parameters. Period settings control sensitivity—lower numbers produce more frequent signals with more noise, higher numbers create fewer signals but with better quality. A 10-period moving average reacts faster than a 50-period, generating more signals but catching more false moves.
Threshold values determine when conditions qualify as signals. An RSI-based indicator might trigger at readings above 60 by default. Adjusting that to 65 produces fewer but stronger signals. Moving it to 55 increases frequency but reduces reliability.
Timeframe matching proves crucial. Signal indicators optimized for 1-hour charts often fail miserably on 5-minute timeframes. The calculation periods that filter noise on higher timeframes become too slow for scalping. Traders running signals on multiple pairs need to test parameters individually—settings that work for slow-moving EUR/CHF rarely translate to volatile GBP/JPY.
Alert customization matters for practical trading. Email alerts work for swing traders checking charts periodically. Push notifications to mobile devices help scalpers monitoring multiple setups. Sound alerts suffice for traders actively watching screens.
Advantages and Real Limitations
Signal indicators excel at removing emotional bias. They fire according to objective criteria, preventing the common trap of seeing what traders want to see in charts. A bearish bias can’t ignore a buy signal when the indicator flashes green.
They also enforce consistency. Following the same signal criteria across hundreds of trades produces measurable results. That data shows whether the approach works, unlike discretionary trading where results vary based on mood, fatigue, or confidence levels.
The objective output helps newer traders learn market behavior. Watching how signals perform in different conditions teaches pattern recognition faster than unguided chart analysis.
But these tools have clear limitations. Signal indicators lag price action because they calculate on historical data. The signal appears after the move starts, not before. Traders miss the first portion of trends waiting for confirmation. In choppy markets, this lag generates numerous false signals as conditions flip back and forth.
No signal indicator works in all market conditions. Trend-following signals get chopped up during consolidation. Mean-reversion signals fail when strong trends develop. The indicators can’t distinguish between ranging and trending markets automatically—traders must make that assessment.
Optimization creates curve-fitting risks. A trader could backtest parameters until finding settings that performed perfectly over historical data, only to discover those settings fail completely in live trading. The past doesn’t predict the future with technical indicators.
How Signal Indicators Compare to Manual Analysis
Trading with signal indicators differs fundamentally from discretionary technical analysis. Manual analysis provides flexibility—traders can adjust to subtle market shifts, incorporate fundamental factors, and exercise judgment on marginal setups. Signal indicators offer none of that nuance.
But discretionary trading introduces the psychological element. Fear, greed, and hope cloud judgment. Fatigue degrades pattern recognition. Signal indicators maintain consistent standards regardless of the trader’s mental state.
Combining approaches often produces better results than either alone. Traders might use signal indicators to identify potential setups, then apply discretionary analysis to filter quality. Or they might trade signals automatically on some pairs while manually trading others based on fundamental views.
How to Trade with MT4 Signal Indicator
Buy Entry

- Wait for candle close confirmation – Never enter on a signal arrow that appears mid-candle. Wait until the current bar closes to avoid false signals that disappear when price reverses before period ends.
- Check trend alignment on higher timeframe – If trading EUR/USD on 1-hour charts, confirm the 4-hour chart shows upward momentum. Don’t take buy signals when the daily trend points down.
- Verify signal appears above key support – Buy signals work best when they fire 10-20 pips above recent support zones or round numbers like 1.0800 on EUR/USD, giving the trade room to breathe.
- Set stop loss 5-10 pips below signal candle low – Place your stop beneath the entry candle’s low point, typically 15-25 pips on major pairs during London/New York sessions to account for normal volatility.
- Skip signals during major news releases – Avoid taking buy signals within 30 minutes before or after high-impact news events like NFP or FOMC, when whipsaw action invalidates technical setups.
- Require RSI above 50 for momentum confirmation – Don’t chase buy signals when RSI reads below 45, indicating weak underlying momentum that often leads to failed breakouts.
- Exit half position at 1.5x risk – If you risk 20 pips, take profit on 50% of your position at +30 pips, then trail stops on the remainder to let winners run.
- Ignore signals in tight 30-pip ranges – When GBP/USD or other volatile pairs consolidate within narrow 25-30 pip ranges on 15-minute charts, signal accuracy drops below 40%.
Sell Entry

- Confirm signal prints below resistance levels – Sell signals perform best when they appear 10-20 pips under recent resistance or psychological levels like 1.1000 on EUR/USD, providing clear rejection confirmation.
- Match with bearish higher timeframe structure – On 1-hour GBP/USD charts, only take sell signals when the 4-hour shows lower highs and lower lows, avoiding counter-trend trades.
- Place stop 5-10 pips above entry candle high – Position stops above the signal candle’s peak, usually 20-30 pips on EUR/USD during active sessions to survive normal pullbacks.
- Wait for candle closure before entering – Don’t jump on sell arrows that flash mid-bar. Price often spikes up before closing lower, triggering premature stops on early entries.
- Avoid signals when RSI shows bullish divergence – Skip sell signals if RSI makes higher lows while price makes lower lows on 1-hour or 4-hour charts—divergence often precedes reversals.
- Check ADX reads above 20 for trend strength – Sell signals in weak trends (ADX below 20) fail 60%+ of the time. Wait for confirmed directional movement before entering.
- Scale out at 2:1 reward-risk ratio – Close 50% of position when profit hits twice your risk amount. If risking 25 pips, bank half at +50 pips and move stops to breakeven.
- Reject signals in Friday afternoon sessions – After 12 PM EST on Fridays, liquidity drops and ranges tighten. Signal reliability decreases as traders close weekly positions regardless of technical setups.
Practical Takeaways for Traders
MT4 signal indicators provide objective entry and exit criteria that remove emotional interference from trading decisions. They work best when traders understand the underlying logic, test parameters on specific pairs and timeframes, and accept that no tool works perfectly in all conditions. The real value comes from consistency—following the system through winning and losing periods to determine actual edge. Trading forex carries substantial risk, and signal indicators don’t guarantee profits, but they can impose discipline that many traders lack when relying solely on subjective analysis. The question isn’t whether signal indicators work—it’s whether traders can maintain the discipline to follow systematic signals even when instinct screams otherwise.
Recommended MT4/MT5 Broker
XM Broker
- Free $50 To Start Trading Instantly! (Withdraw-able Profit)
- Deposit Bonus up to $5,000
- Unlimited Loyalty Program
- Award Winning Forex Broker
- Additional Exclusive Bonuses Throughout The Year
- Exclusive 90% VIP Cash Rebates for all Trades!


Already an XM client but missing out on cashback? Open New Real Account and Enter this Partner Code: VIP90


