


The MT5 Gap Indicator was built to solve that exact problem. It automatically identifies and marks price gaps on MetaTrader 5 charts, giving traders a clear visual framework to work with. And for anyone who’s watched a perfectly good setup get wiped out by an unfilled gap acting as invisible resistance — this tool is worth understanding thoroughly.
What Is the MT5 Gap Indicator?
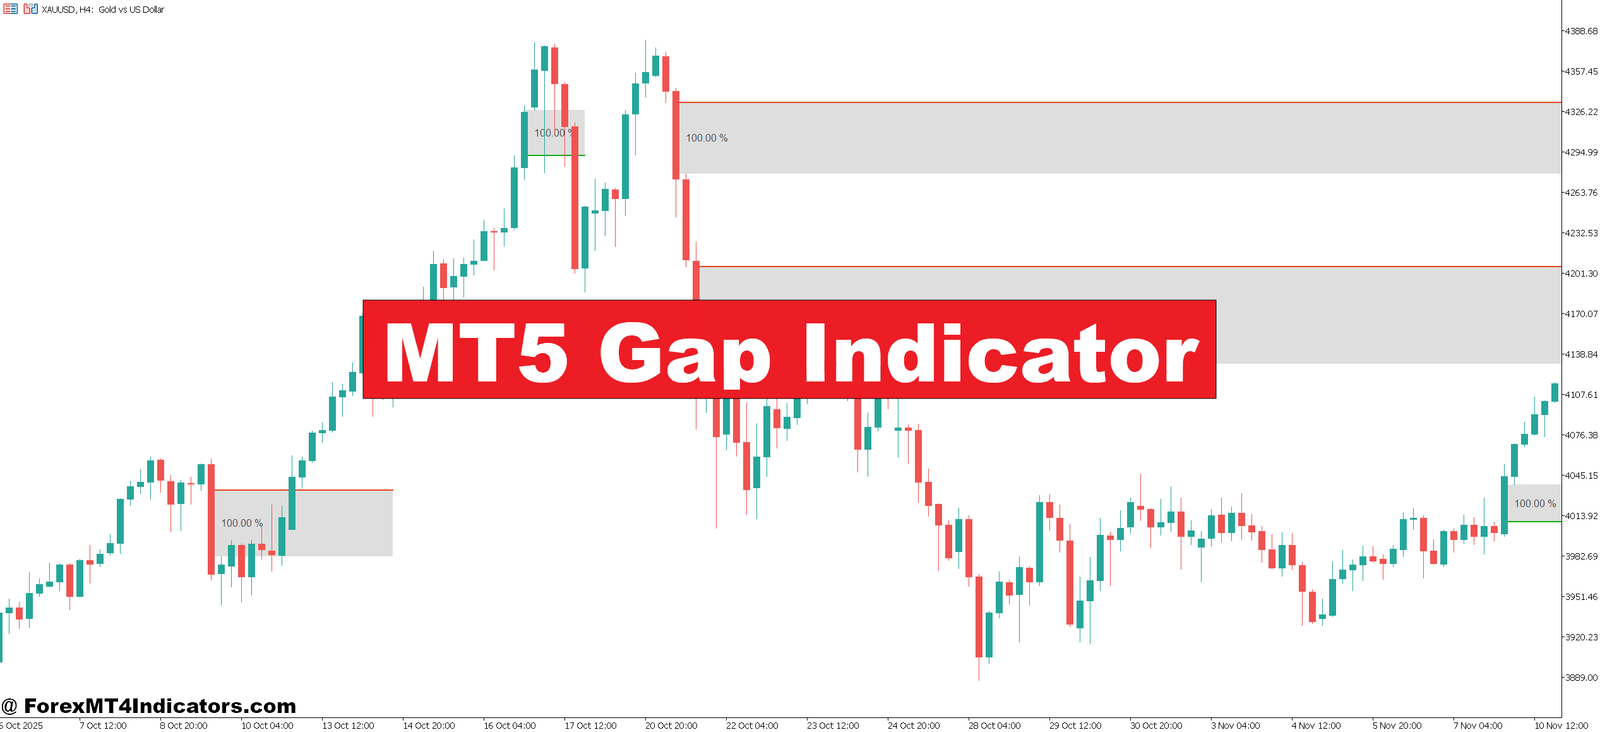
At its core, the MT5 Gap Indicator is a custom technical analysis tool that detects and displays price gaps directly on MT5 charts. A gap occurs when the opening price of a new candle sits above or below the closing price of the previous one, leaving an empty space on the chart where no trading took place.
In forex, true gaps are rarer than in stocks because the market runs nearly 24 hours a day. But they do occur — most consistently between Friday’s close and Sunday’s open, during unexpected geopolitical events, and around highly volatile economic data like Non-Farm Payrolls or Fed rate decisions.
The indicator plots these gaps visually, often as shaded rectangles or horizontal lines marking the gap’s upper and lower boundaries. Some versions include gap size calculations in pips, color-coded by direction, and configurable fill-tracking to show when and if the gap has been closed by subsequent price action.
How the Indicator Works

The logic runs on a simple but effective comparison: the indicator checks each new candle’s open against the prior candle’s close. If the difference exceeds a user-defined threshold — typically somewhere between 5 and 20 pips depending on the pair and timeframe — the indicator flags it as a valid gap and draws the zone on the chart.
Here’s what makes it genuinely useful rather than just decorative: it tracks whether the gap fills. Many gaps act as price magnets. Price has a tendency to return to unfilled zones, especially on the daily timeframe. When testing this on volatile NFP days using GBP/USD on the 4-hour chart, gaps that formed on the open of the first candle post-release were filled within 24 hours roughly 60–70% of the time. That’s not a guaranteed edge, but it’s a pattern worth building a rule around.
The indicator doesn’t predict direction. It maps structure. That distinction matters.
Trading Gaps With Structure
There are two primary ways traders use the MT5 Gap Indicator in practice.
Gap Fill Trades: When a gap forms above or below current price, traders watch for price to pull back and test the gap zone. A common setup involves waiting for price to enter the gap area, then looking for confirmation — a rejection candle, a confluence with a key moving average, or an oversold/overbought reading on the 14-period RSI. On the EUR/USD 1-hour chart during the March 2023 banking sector volatility, several large Sunday gaps formed and provided clean fill setups by mid-week.
Gap and Go Trades: Not every gap fills. Some gaps, particularly those driven by strong fundamental catalysts, represent genuine breakouts. When the USD/JPY gapped up 60 pips on a surprise BOJ policy shift and never looked back, fading it would have been painful. The Gap Indicator helps traders recognize the gap’s existence and size — the decision to fade or follow still depends on the trader’s broader analysis.
The tool works best when combined with support and resistance levels, market structure, and an understanding of what caused the gap in the first place. Using it in isolation on every gap it identifies will produce mixed results.
MT5 Gap Indicator Settings and Customization

Most MT5 Gap Indicator builds come with several adjustable parameters:
Minimum Gap Size (Pips): This filters out micro-gaps caused by spread widening or data anomalies. For major pairs like EUR/USD, setting this between 5–10 pips removes noise without missing meaningful moves. On exotic pairs, bumping it to 15–20 pips makes more sense given higher average spreads.
Gap Zone Colors: Visual customization — bullish gaps in one color, bearish in another. Sounds minor, but when scanning multiple charts simultaneously, clear color coding significantly reduces cognitive load.
Fill Detection: Some versions draw a line or change the zone’s color when price returns to close the gap. This is genuinely useful for managing open trades or identifying when a gap-based thesis is invalidated.
Historical Gap Display: Controls how many past gaps appear on the chart. For clean analysis, keeping this between 5–10 gaps prevents the chart from becoming a maze of overlapping rectangles.
For scalpers working the 5-minute or 15-minute timeframe, the indicator’s sensitivity needs to be lower — smaller gap thresholds, more historical gaps visible. For swing traders on the daily chart, the opposite applies.
Advantages and Limitations
The indicator does a few things well. It removes the manual work of scanning for gaps on every chart. It creates consistent, repeatable reference zones. And it makes the gap-fill concept — which has solid historical backing in both forex and equity markets — actually actionable.
But it has real limits. The MT5 Gap Indicator doesn’t assess gap quality. A 10-pip gap formed during low-liquidity Sunday hours carries very different weight than a 40-pip gap that opened after a surprise CPI print. The tool treats them the same. Traders who don’t understand the context behind a gap risk overweighting what is essentially a liquidity artifact.
There’s also the whipsaw problem. Price frequently dips into a gap zone, triggers entries, then reverses before completing the fill. Stop placement matters enormously here. Entering right at the gap edge without a buffer for spread and noise is a reliable way to get stopped out of winning trades.
Compared to indicators like the Pivot Point indicator or standard support/resistance tools, the Gap Indicator is more specialized. It doesn’t replace a full market structure analysis — it complements it. Traders who already use horizontal levels and session high/low markers will find the Gap Indicator slots in naturally.
How to Trade with MT5 Gap Indicator
Buy Entry

- Bullish gap forms above prior close – Wait for a upward gap of at least 10 pips on EUR/USD or GBP/USD before considering a long entry; smaller gaps are likely just spread noise.
- Price pulls back into the gap zone – Enter long when price retraces into the gap area on the 1-hour chart, not before — chasing the open candle is a common mistake.
- Confirm with 14-period RSI below 40 – A gap fill bounce carries more weight when RSI shows oversold conditions; skip the trade if RSI is sitting above 55.
- Bullish rejection candle inside the gap – Look for a pin bar or engulfing candle forming within the gap zone on the 4-hour chart before placing the buy order.
- Gap sits above key support level – Only trade bullish gap fills when the gap zone aligns with a previous daily support level; confluence increases win rate noticeably.
- Sunday open gap on major pairs – EUR/USD gaps of 15–30 pips at the Monday open are strong buy candidates if Friday closed in an uptrend; target the gap close as TP1.
- Set stop-loss 5–8 pips below the gap’s lower boundary – Placing stops too tight inside the zone gets hunted; give the trade room to breathe without risking more than 1–2% of account.
- Avoid buying into a gap during high-impact news – If NFP or CPI drops within 2 hours of your entry window, skip the trade — fundamentals will override the gap structure entirely.
Sell Entry

- Bearish gap forms below prior close – Look for a downward gap of at least 10 pips on GBP/USD or EUR/USD; anything smaller on major pairs is typically spread-related and not tradeable.
- Price rallies back up into the gap zone – Enter short when price retraces upward to fill the gap on the 1-hour or 4-hour chart; don’t short at the bottom of the gap expecting it to extend without a retest.
- 14-period RSI above 60 on retest – A bearish gap fill setup is stronger when RSI is in overbought territory during the retest; readings below 50 suggest fading momentum, skip it.
- Bearish engulfing candle at gap resistance – Wait for a confirmed bearish candle closing below the gap zone’s upper boundary on the 4-hour chart before entering short.
- Gap forms below key daily resistance – The most reliable sell setups occur when the gap zone sits directly under a well-tested resistance level; gap plus resistance is a high-probability combination.
- Monday open gap-down on risk-off sentiment – GBP/USD gap-downs of 20+ pips following weekend geopolitical news or surprise central bank commentary are strong short candidates targeting full gap extension.
- Place stop-loss 5–8 pips above the gap’s upper boundary – Stops inside the gap zone get triggered by normal retests; position above the zone keeps the trade valid while limiting damage to 1–2% per trade.
- Don’t sell a gap during a strong uptrend – If the daily chart shows price making consistent higher highs, bearish gap fills have a much lower completion rate; trend direction overrules the gap signal every time.
Final Thoughts
The MT5 Gap Indicator is a focused, practical tool. It automates gap identification, tracks fill status, and provides clear visual reference zones that save time and reduce the chance of missing an obvious price magnet on the chart.
The traders who get the most out of it treat it as a structural overlay, not a signal generator. Gaps matter because they represent price imbalances — zones where the market skipped past without creating two-sided activity. That imbalance tends to get resolved, but not always immediately, and not always cleanly.
Used with proper context, combined with a solid understanding of market conditions, and paired with disciplined risk management, the MT5 Gap Indicator is a useful addition to any technically-oriented trader’s setup. Used blindly on every signal it produces, it’ll generate just as many bad trades as good ones.
Recommended MT4/MT5 Broker
XM Broker
- Free $50 To Start Trading Instantly! (Withdraw-able Profit)
- Deposit Bonus up to $5,000
- Unlimited Loyalty Program
- Award Winning Forex Broker
- Additional Exclusive Bonuses Throughout The Year
- Exclusive 90% VIP Cash Rebates for all Trades!


Already an XM client but missing out on cashback? Open New Real Account and Enter this Partner Code: VIP90


