


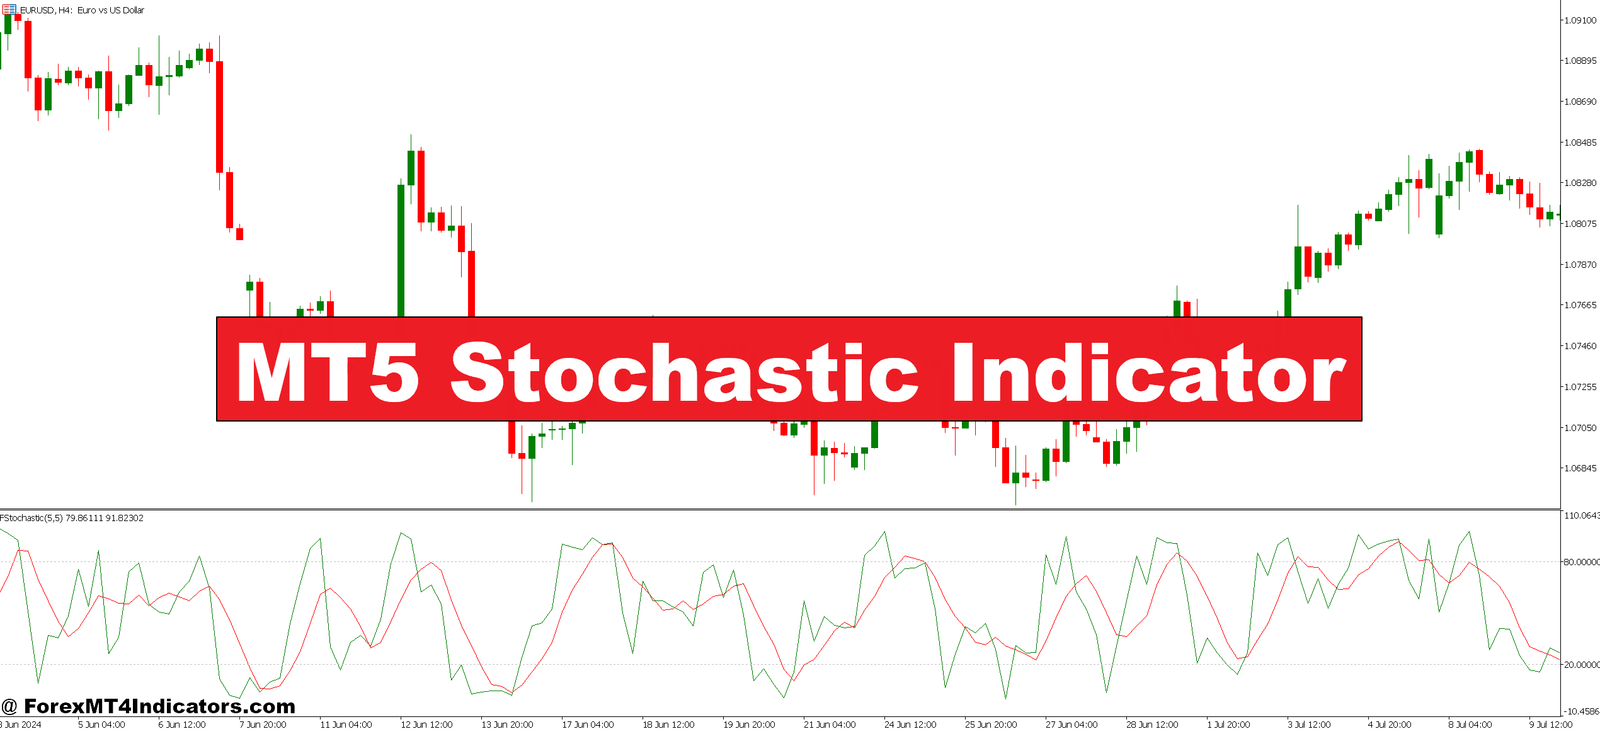

The stochastic oscillator tracks momentum by comparing the most recent closing price to the price range over a specific lookback period. It’s displayed as two lines %K (the fast line) and %D (the slow signal line) that fluctuate between 0 and 100.
Here’s what it’s really telling you: When the stochastic reads 80 or above, the current price is near the top of its recent range. When it drops below 20, price is trading near the bottom of that range. Think of it as a snapshot of whether bulls or bears have been winning the recent battle.
The standard MT5 setup uses a 5-3-3 configuration (5-period %K, 3-period %D, 3-period smoothing), though many traders adjust these based on their timeframe. George Lane, who developed this indicator in the 1950s, believed that momentum changes direction before price does which is why traders watch for stochastic divergence and crossovers.
How the Calculation Works
The math behind the stochastic isn’t complicated, but understanding it helps you grasp why the indicator behaves the way it does.
The %K line calculation looks like this: Take the current close, subtract the lowest low from your lookback period, then divide by the range (highest high minus lowest low) over that same period. Multiply by 100. That percentage tells you where price currently sits within the recent range.
The %D line is simply a moving average of %K usually a 3-period simple moving average. This smoothing creates the signal line that helps filter out noise and reduce false signals.
When traders talk about “fast” versus “slow” stochastic, they’re referring to how much smoothing gets applied. The fast version is more responsive but generates more false signals. The slow version (default on MT5) applies additional smoothing to both lines, making it more reliable but slightly delayed.
Trading the Stochastic in Real Market Conditions

Let’s get practical. The textbook approach says buy when stochastic crosses above 20 from oversold territory, and sell when it crosses below 80 from overbought. But anyone who’s tried this on a live account knows it’s not that simple.
I’ve found the stochastic works best in two specific scenarios. First, during range-bound markets where price lacks clear directional bias. On GBP/JPY’s 4-hour chart last month, price chopped between 188.50 and 191.20 for two weeks. Traders who bought near the support zone when stochastic dipped below 20 and sold near resistance when it climbed above 80 had multiple high-probability setups.
Second, use it to spot divergence during trends. When USD/JPY was trending up in December, price made higher highs around 157.80, but the stochastic formed lower highs. That bearish divergence signaled weakening momentum before price reversed giving alert traders a heads-up to tighten stops or take profits.
The biggest mistake? Shorting just because stochastic hits overbought during a strong uptrend. During trending markets, the indicator can stay pegged in extreme territory for dozens of candles while price continues running. That’s where you need confirmation from price action wait for a lower high or rejection at resistance before acting on stochastic signals.
Customizing Settings for Different Trading Styles

Default settings don’t fit every trader or market condition. Day traders on the 5-minute or 15-minute charts often find the standard 5-3-3 too slow. Bumping it to 8-3-3 or even 10-3-3 reduces whipsaw signals during the London and New York sessions.
Swing traders working off daily or weekly charts might do the opposite using a faster 3-2-2 setup to catch momentum shifts earlier. The tradeoff is always the same: faster settings give you earlier signals but more false positives, while slower settings lag but filter noise better.
Some traders adjust the overbought/oversold levels too. Instead of the traditional 80/20, they use 70/30 for more signals or 85/15 for higher-quality setups. Test what works with your preferred currency pairs and timeframe. Volatile pairs like GBP/NZD might need wider bands, while stable pairs like EUR/CHF work fine with standard levels.
One trick I’ve seen experienced traders use: combine two stochastic indicators with different periods on the same chart. When both align say a 5-3-3 and a 14-3-3 both showing oversold conditions it confirms momentum is shifting across multiple timeframes.
Strengths, Weaknesses, and When It Fails

The stochastic excels at identifying potential reversal points in ranging or corrective markets. It’s also excellent for divergence trading, often spotting momentum shifts before they’re obvious on price charts. The clear visual signals (crossovers, extreme readings) make it beginner-friendly too.
But here’s where it struggles. During strong trends, the indicator becomes nearly useless as a standalone tool it’ll scream “overbought” while price continues climbing for hours. You’ll also get chopped up during consolidation periods when price whipsaws back and forth, triggering false signals on both sides.
The stochastic doesn’t tell you anything about trend direction or strength. It only measures where price sits within its recent range. That means you need context from other tools moving averages, support and resistance levels, or trend lines to know whether you’re trading with or against the dominant trend.
Risk management matters even more with oscillator-based entries. Just because stochastic shows oversold doesn’t mean price can’t drop another 50 pips before reversing. Set your stops based on price structure, not indicator levels.
How It Compares to RSI and Other Oscillators
Traders often compare the stochastic to the Relative Strength Index (RSI), and they’re both momentum oscillators with overbought/oversold readings. The key difference? RSI measures the magnitude of recent price changes, while stochastic measures position within the recent range.
In choppy markets, stochastic tends to be more responsive because it reacts to the price range directly. RSI might stay more neutral during the same conditions. That said, RSI tends to work better during trends because its calculation doesn’t get pinned to extremes as easily.
Another option is the Stochastic RSI, which applies stochastic calculations to RSI values. It’s more sensitive than either indicator alone, generating signals faster but also producing more false readings. It’s overkill for most traders.
What works? Many successful traders use stochastic alongside trend-following indicators. Combine it with a 50-period or 200-period moving average to filter signals only take oversold buy signals when price is above the MA, and only take overbought sell signals when price is below it.
How to Trade with MT5 Stochastic Indicator
Buy Entry

- Oversold crossover below 20 – Wait for %K line to cross above %D line while both are under 20 on EUR/USD 1-hour chart, then enter on the next candle open with 20-30 pip stop loss.
- Bullish divergence confirmation – When price makes lower lows but stochastic forms higher lows on 4-hour GBP/USD, enter after stochastic crosses above 30 with stop below recent swing low.
- Range support bounce – Buy when stochastic hits 15-20 near established support on daily timeframe, but skip this signal if price breaks support by more than 10 pips.
- Double-dip setup – Enter when stochastic drops below 20 twice within 8-12 candles without breaking support, signaling strong buying pressure building underneath.
- Trend pullback entry – On uptrending pairs above 200 EMA, buy when stochastic touches 40-50 (not waiting for 20), catching the dip early with tighter 15-pip stops.
- Avoid during strong downtrends – Don’t buy oversold readings when price is below 50-period MA on 4-hour charts, as stochastic can stay oversold while price keeps dropping.
- Wait for candle confirmation – Never enter mid-candle on stochastic signals; wait for the candle to close above entry level to avoid false breakouts that reverse quickly.
- Risk only 1-2% per trade – Even with perfect stochastic signals, limit position size so your stop loss equals 1-2% of account balance maximum.
Sell Entry

- Overbought crossover above 80 – Sell when %K crosses below %D while both lines are above 80 on EUR/USD 4-hour chart, placing stops 25-35 pips above recent swing high.
- Bearish divergence play – When price makes higher highs but stochastic forms lower highs on daily GBP/USD, short after stochastic drops below 70 with confirmation candle.
- Range resistance rejection – Sell when stochastic reaches 80-85 at proven resistance on 1-hour charts, but cancel if price breaks resistance cleanly with volume.
- Failed breakout signal – Short when stochastic hits overbought (80+), price touches resistance, then reverses with bearish engulfing candle within 2-3 periods.
- Trend retest entry – In downtrends below 200 EMA, sell when stochastic bounces to 50-60 zone during pullbacks, entering earlier than waiting for full 80 reading.
- Skip in strong uptrends – Ignore overbought signals when price is 100+ pips above 50 MA on 4-hour charts, as trending markets stay overbought for extended periods.
- News event caution – Don’t trade stochastic signals 30 minutes before or after major news (NFP, FOMC, CPI), as volatility creates false signals and wide spreads.
- Trail stops after 30+ pips – Once your short runs 30-40 pips in profit, move stop to breakeven and let stochastic staying oversold guide your exit timing.
Making the Stochastic Work for Your Trading
The MT5 Stochastic Indicator won’t transform your trading overnight, but it can provide real value when used intelligently. It works best for timing entries in ranging markets, spotting divergence during trends, and confirming momentum shifts alongside other analysis methods.
Keep your expectations realistic. No indicator catches every move or avoids every losing trade. The traders who profit consistently with stochastic use it as one piece of a broader strategy combining it with price action, support and resistance, and solid risk management. They also know when to ignore it completely, like when markets are trending hard or during high-impact news events.
Trading forex carries substantial risk, and indicators are tools, not guarantees. Test any setup on a demo account first, keep your position sizes manageable, and never risk capital you can’t afford to lose. The stochastic can help you read momentum but the decisions, and the responsibility, remain yours.
Recommended MT4/MT5 Broker
XM Broker
- Free $50 To Start Trading Instantly! (Withdraw-able Profit)
- Deposit Bonus up to $5,000
- Unlimited Loyalty Program
- Award Winning Forex Broker
- Additional Exclusive Bonuses Throughout The Year
- Exclusive 90% VIP Cash Rebates for all Trades!


Already an XM client but missing out on cashback? Open New Real Account and Enter this Partner Code: VIP90


