







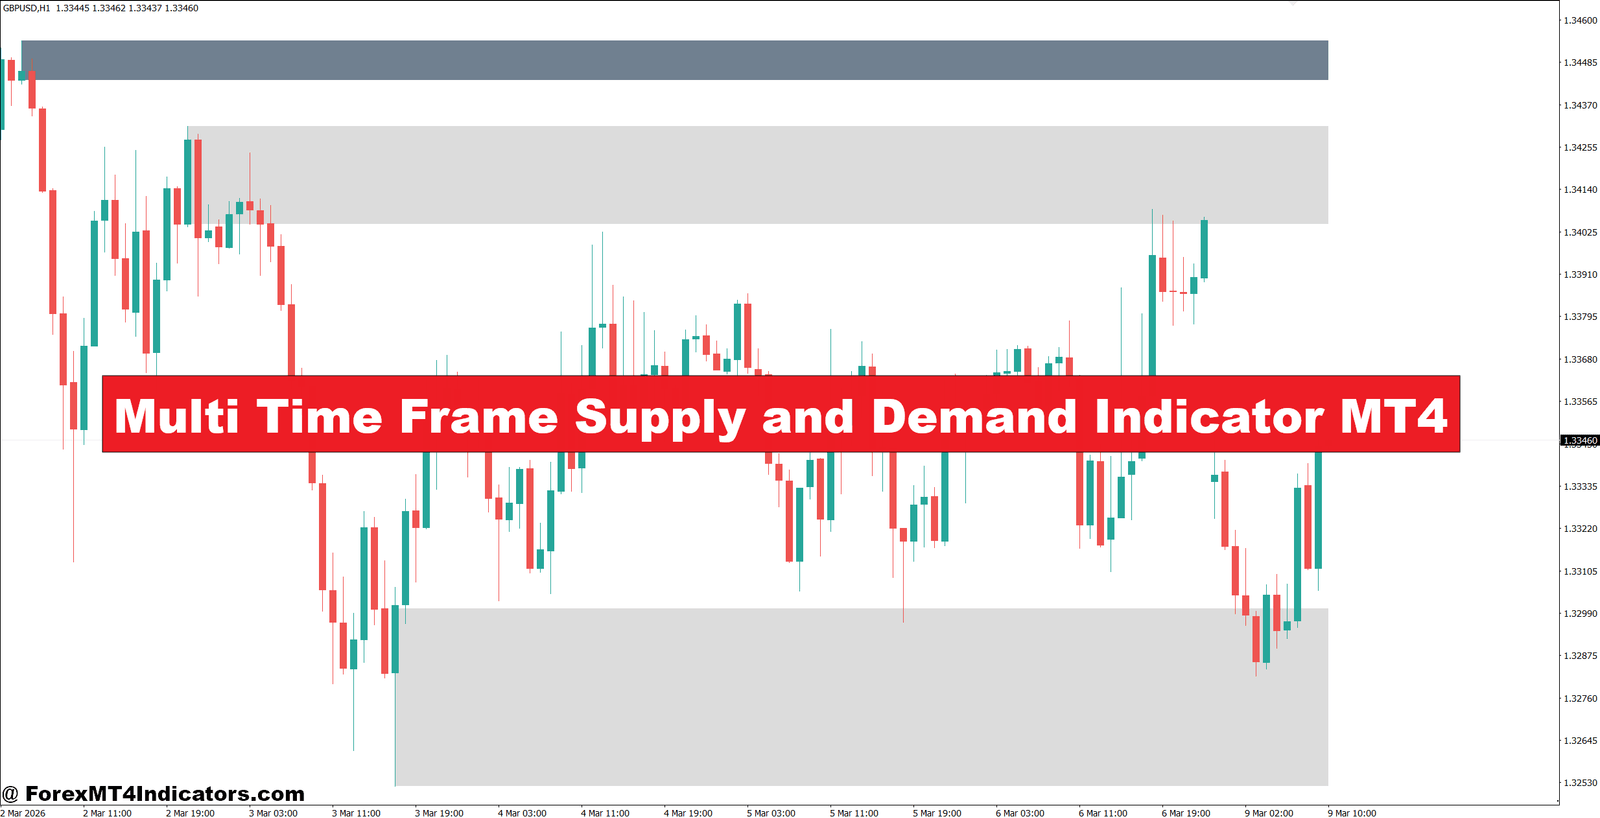
The Multi Time Frame Supply and Demand Indicator MT4 can help traders organize their chart around areas where buying or selling pressure previously appeared.
The problem is that supply and demand zones can be difficult to mark consistently. Traders often draw too many levels, enter after a zone has already been tested several times, or get caught in a fake-out. A few bad entries can lead to frustration, wider stops, and unnecessary account drawdown.
This indicator brings supply and demand analysis from multiple timeframes into one MT4 chart. Instead of relying only on the current timeframe, traders can compare higher-timeframe zones with lower-timeframe entries. That gives price action more context before a trade is opened.
What Is the Multi Time Frame Supply and Demand Indicator MT4?
The indicator is a technical analysis tool that identifies potential supply and demand areas and displays them across different timeframes. Demand zones generally represent areas where strong buying previously pushed price higher. Supply zones mark areas where selling pressure caused a sharp decline.
The key feature is the multi-timeframe approach. A trader watching the 15-minute chart can still monitor supply and demand zones formed on the 1-hour or 4-hour chart.
The underlying logic usually focuses on price displacement, swing structure, and the origin of strong moves. A typical demand zone may form around a consolidation or base before an aggressive bullish candle sequence. Supply works in the opposite direction.
For example, suppose EUR/USD spends 12 candles moving between 1.0820 and 1.0830 on the 1-hour chart. Price then breaks upward and reaches 1.0880 within several candles. The area around 1.0820–1.0830 may become a demand zone because strong buying originated there.
The indicator doesn’t predict the future. It highlights areas where traders can watch for a reaction.
How Traders Use Multiple Timeframes
The biggest advantage comes from combining context rather than treating every zone as an immediate entry signal.
A trader might start with the daily or 4-hour chart to identify the broader market structure. The 1-hour chart can then provide intermediate zones, while the 15-minute or 5-minute chart can help refine the entry.
Consider GBP/USD during a bullish session. The 4-hour chart shows demand between 1.2670 and 1.2700. Price later falls from 1.2780 toward that zone. Instead of buying immediately, a trader can move to the 15-minute chart and wait for evidence that sellers are losing control.
A bullish engulfing candle, a break above a short-term lower high, or a strong rejection wick can provide additional confirmation. If the entry occurs near 1.2705, a stop below 1.2670 may risk around 35 pips. A target near 1.2770 would offer roughly a 1:1.8 risk-to-reward ratio.
That approach is different from simply buying whenever the indicator paints a demand area.
Choosing Settings for Different Markets
Indicator settings should match the trader’s timeframe and the pair’s volatility. A setting that works well on EUR/USD may create too many zones on GBP/JPY because the latter can make much larger intraday moves.
On a 5-minute chart, traders may prefer fewer, stronger zones to avoid getting trapped in market chop. On the 1-hour and 4-hour charts, broader zones can be more useful because they represent larger price moves.
A practical setup might look like this:
- 4-hour chart for major supply and demand zones
- 1-hour chart for intermediate structure
- 15-minute chart for trade confirmation
- 5-minute chart only for precise entry timing
The exact parameters depend on how the indicator defines swing strength, zone width, and historical lookback. Traders should test those values rather than assuming one preset works for every pair.
Supply and Demand Entry Examples

One common setup occurs when a higher-timeframe demand zone aligns with an established bullish trend.
Suppose USD/CAD is trading above its 50-period moving average on the 1-hour chart. A 4-hour demand zone sits between 1.3610 and 1.3640. Price retraces from 1.3720 and enters the zone. Instead of entering at the first touch, the trader watches the 15-minute chart.
If price rejects 1.3620 and then breaks a short-term resistance level at 1.3645, the setup becomes more interesting. An entry around 1.3650 with a stop near 1.3615 creates approximately 35 pips of risk. A target at 1.3720 would provide about 70 pips, giving a 1:2 risk-to-reward structure.
The opposite setup applies to supply zones. Imagine XAU/USD reaches a 1-hour supply zone around $2,485–$2,492 after a strong rally. If the 15-minute chart forms a lower high near $2,490 and breaks short-term support at $2,484, sellers may have a clearer technical setup.
But gold can move quickly. A stop of only $2–$3 may be too tight during high-impact news. Position size should be adjusted to the stop distance instead of forcing the stop into an arbitrary range.
When testing supply and demand methods around volatile NFP releases, traders may see zones breached by large candles before price reverses. That is one reason confirmation and risk control matter.
Advantages and Limitations
The indicator has several practical strengths. It can reduce the time spent manually marking zones, provide higher-timeframe context, and make it easier to compare market structure across charts.
It can also help traders avoid random entries. A buy signal occurring directly below major 4-hour supply deserves more caution than the same signal appearing after price leaves a strong demand area.
Still, the indicator has limitations.
Zones can become weaker after repeated tests. A demand area that has been touched four or five times shouldn’t receive the same weight as a fresh zone. News can also invalidate technically clean levels within seconds.
Another issue is hindsight. Some indicators may appear highly accurate when viewed on historical charts because traders can see the final outcome. Live trading is different. Zone calculations can change as new candles form, depending on the indicator’s design.
What makes this different from a simple support and resistance indicator? The focus is less on individual horizontal price levels and more on areas associated with strong buying or selling activity across several timeframes.
Multi Time Frame Supply and Demand vs. Other Indicators
Traditional support and resistance tools are useful for marking previous highs, lows, and reaction points. Supply and demand analysis goes a step further by focusing on the price area where a strong move originated.
Moving averages provide trend information but don’t identify precise reaction zones. RSI can show momentum and potential overbought or oversold conditions, yet an RSI reading of 70 doesn’t automatically mean price will fall.
The strongest approach can involve several pieces of evidence. For instance, a trader may find 4-hour demand, see price holding above the 200-period moving average, and then wait for a bullish structure break on the 15-minute chart.
That combination is usually more useful than taking a trade from one indicator alone.
Trading forex carries substantial risk. No indicator guarantees profits. Traders should backtest the settings, use sensible position sizing, and avoid risking money they cannot afford to lose.
How to Trade with Multi Time Frame Supply and Demand Indicator MT4
Buy Entry

- Confirm 4-Hour Demand – Look for price entering a strong 4-hour demand zone and avoid buying if the zone has already been tested 3+ times.
- Check Daily Trend – Prefer BUY setups when the daily structure is bullish and price makes higher highs and higher lows.
- Wait for 15-Minute Rejection – On EUR/USD, wait for a bullish rejection candle inside demand before entering, ideally risking 10–20 pips.
- Confirm 1-Hour Breakout – Enter after price breaks the previous 1-hour lower high with a strong bullish candle.
- Target 1:2 Risk/Reward – If the stop is 20 pips, aim for at least 40 pips of potential profit.
- Control Position Risk – Risk no more than 1% of account equity on a single BUY setup.
- Avoid Major News – Don’t enter GBP/USD immediately before NFP, CPI, or interest-rate announcements because spreads and volatility can expand sharply.
- Trail After 1R – Once price reaches approximately 1R profit, consider moving the stop toward breakeven after clear bullish continuation.
Sell Entry

- Confirm 4-Hour Supply – Wait for price to reach a clear 4-hour supply zone before considering a SELL.
- Check Daily Structure – Favor shorts when the daily chart shows lower highs and lower lows rather than fighting a strong uptrend.
- Watch 15-Minute Rejection – On GBP/USD, look for bearish rejection inside supply before risking around 15–25 pips.
- Confirm 1-Hour Breakdown – Consider entry after price breaks a nearby 1-hour support level with strong bearish momentum.
- Set a Defined Stop – Place the stop above the supply zone, commonly around 15–30 pips depending on pair volatility.
- Aim for 1:2 Minimum – With a 25-pip stop, look for roughly 50 pips of downside potential before entering.
- Limit Account Risk – Keep individual SELL trades near 1% risk and reduce size during highly volatile sessions.
- Skip Weak Zones – Don’t sell when price repeatedly breaks through supply or when the daily trend strongly favors buyers.
Final Thoughts
The Multi Time Frame Supply and Demand Indicator MT4 can make zone analysis more organized, especially for traders who work across several chart periods. Its real value comes from combining higher-timeframe areas with lower-timeframe price action rather than treating every marked zone as a trade signal.
The main lessons are straightforward: higher-timeframe zones can provide stronger context, fresh zones generally deserve more attention than repeatedly tested ones, and entry confirmation can reduce unnecessary fake-outs. Risk management still comes first.
A trader testing this method could start with EUR/USD or GBP/USD, use the 4-hour chart for zones, and refine entries on the 15-minute chart. After 50–100 properly recorded trades, the results will say far more than a handful of winning examples.
Recommended MT4/MT5 Broker
XM Broker
- *FREE $50 To Start Trading Instantly! (Withdraw-able Profit)
- Deposit Bonus up to $5,000
- Unlimited Loyalty Program
- Award Winning Forex Broker
- Additional Exclusive Bonuses Throughout The Year


>> Sign Up for XM Broker Account here <<
(Free MT4 Indicators Download)


