


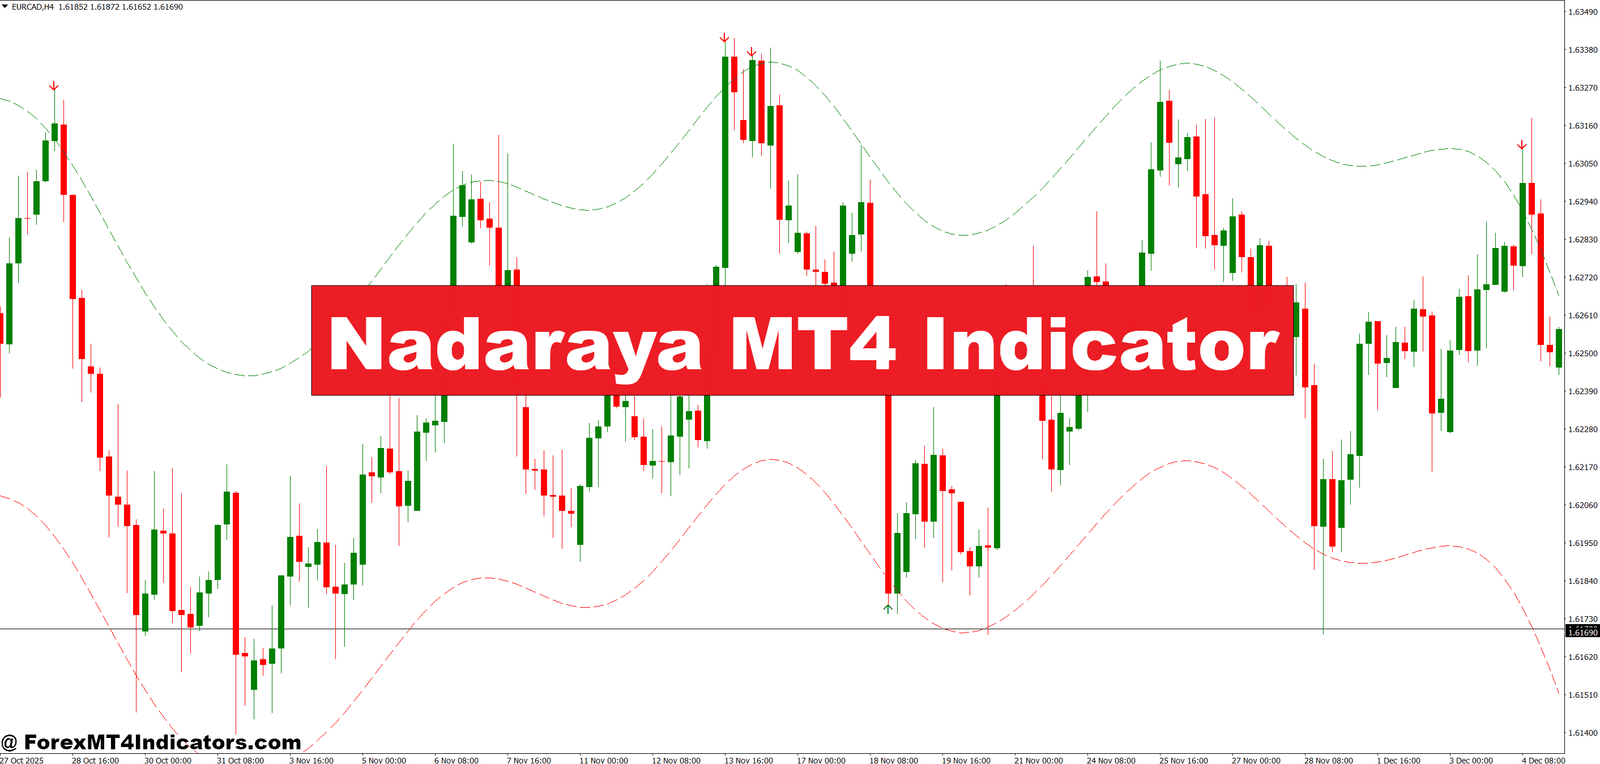

The Nadaraya MT4 Indicator is a smoothing tool based on the Nadaraya-Watson kernel regression method. In simple terms, it plots a curved line that follows price more smoothly than a standard moving average. Instead of giving equal weight to past prices, it assigns more importance to recent data.
On an MT4 chart, it usually appears as a single line that adapts to market movement. Some versions also include upper and lower bands to highlight overextended price zones. Traders often compare it to a moving average, but the behavior is different. It bends faster during trend changes and flattens out during consolidation.
Because of this, many traders treat it as a dynamic support and resistance guide rather than a pure trend filter.
How the Indicator Works in Practice
The calculation behind the Nadaraya MT4 Indicator relies on kernel regression. Each price point is weighted based on its distance from the current bar. Prices closer to the present matter more, while older data fades quickly. The result is a smoother curve that reacts without sharp lag.
On a 1-hour EUR/USD chart, this becomes clear. During a steady uptrend, the indicator slopes upward and price tends to respect it on pullbacks. When price closes well below the line after several hours of support, that often signals a deeper correction or trend shift.
Some traders also watch the slope. A flat Nadaraya line during the Asian session often hints at low momentum and range-bound action. When London opens and the slope turns sharply, it signals fresh participation.
That said, this indicator repaints in many versions. The most recent values can adjust as new candles form. Experienced traders factor this in and avoid using it as a standalone entry trigger.
Practical Trading and Examples

Traders use the Nadaraya MT4 Indicator in several ways, depending on style and timeframe.
One common approach is trend pullback trading. For example, on GBP/USD 30-minute charts, price may stay above the indicator during a strong London trend. When price pulls back within 10–15 pips of the line and shows a bullish engulfing candle, some traders look for long entries. Stops often sit 20–25 pips below the recent swing low.
Another use is spotting exhaustion. On volatile NFP days, price often stretches far from its mean. When EUR/USD trades 40 pips above the Nadaraya line on the 15-minute chart and momentum slows, it can warn of a short-term retracement. This doesn’t mean a full reversal, just a pause or pullback.
Range traders also find value. In sideways markets, price crossing back and forth over the indicator highlights chop. That’s usually a signal to reduce position size or stand aside.
Settings, Customization, and Trader Tips

Most versions of the Nadaraya MT4 Indicator come with a bandwidth or smoothing parameter. Lower values make the line more responsive but increase noise. Higher values smooth things out but add lag.
On higher timeframes like H4 or daily charts, traders often increase smoothing to avoid overreacting to single candles. For scalping on M5 or M15, tighter settings help catch short-term moves, though false signals increase.
Pair behavior matters too. EUR/USD responds well to moderate smoothing. GBP/JPY, with its wider swings, often needs higher values to avoid constant flips.
A practical tip from testing sessions: avoid tweaking settings every trade. Pick parameters that fit the timeframe and stick with them for at least a few weeks. Consistency matters more than perfection.
Advantages, Limitations, and Comparisons
The biggest advantage of the Nadaraya MT4 Indicator is visual clarity. It cleans up price action and helps traders see structure that raw candles sometimes hide. It works well alongside support and resistance and basic market structure analysis.
But there are limits. Repainting is the main one. Signals can look perfect in hindsight but less clear in live trading. That’s why experienced traders combine it with fixed tools like horizontal levels or the 14-period RSI.
Compared to a 20-period EMA, the Nadaraya line reacts faster to turns but offers less reliability on its own. Against indicators like Bollinger Bands, it provides smoother directional bias but less precise volatility measurement.
No indicator replaces risk management. Tight stops during news or low-liquidity sessions still get hit, no matter how clean the setup looks.
Trading forex carries substantial risk. No indicator guarantees profits.
How to Trade with Nadaraya MT4 Indicator
Buy Entry

- Price holds above the Nadaraya line – Enter buys when EUR/USD closes above the line on the 1-hour chart and pulls back within 10–15 pips, showing the trend is still respected.
- Bullish candle at the line – Buy after a bullish engulfing or strong rejection candle forms near the indicator on GBP/USD H1 or H4, confirming buyers stepped in.
- Slope turns upward – Take long setups when the Nadaraya line shifts from flat to upward, especially during London session momentum.
- Distance stretch then pullback – After price moves 30–40 pips away from the line, wait for a retrace toward it before buying to avoid chasing.
- Confluence with support – Buy only when the indicator aligns within 5–10 pips of a clear horizontal support level.
- RSI confirmation – Favor buys when RSI(14) stays above 50 while price respects the Nadaraya line.
- Risk-defined entry – Place stops 20–30 pips below the recent swing low and risk no more than 1–2% per trade.
- Avoid during chop – Don’t buy when the line is flat and price crosses it repeatedly within a 20-pip range.
Sell Entry

- Price stays below the Nadaraya line – Look for sells when GBP/USD closes below the line on the 1-hour chart and fails to reclaim it within 2–3 candles.
- Bearish rejection candle – Sell after a strong bearish pin bar or engulfing candle forms within 10–15 pips of the indicator.
- Downward slope confirmation – Enter shorts when the Nadaraya line angles down clearly on H4, showing sustained selling pressure.
- Overextended move – If EUR/USD trades 35–50 pips below the line on M15 or H1, wait for a pullback before selling.
- Resistance overlap – Favor shorts when the indicator lines up with a known resistance zone or prior session high.
- Momentum check – Take sells when RSI(14) stays below 50 and price can’t close back above the line.
- Controlled risk – Set stops 20–25 pips above the recent swing high and cut trade size in half during news days.
- Skip low-liquidity hours – Avoid selling signals during late Asian session when spreads widen and fake-outs are common.
Conclusion
The Nadaraya MT4 Indicator offers traders a smoother way to read price without relying on rigid averages. It shines when used to:
- Spot trend direction and clean pullbacks
- Identify overextended price moves during volatile sessions
- Reduce chart noise in trending or ranging conditions
Its value comes from context, not signals alone. Traders who pair it with solid risk rules, session awareness, and market structure often get the most out of it. The indicator won’t prevent losses, and repainting needs respect. But as part of a disciplined approach, the Nadaraya MT4 Indicator can help traders stay aligned with price instead of chasing every move. The next step is simple: test it on one pair, one timeframe, and track results like a professional.
Recommended MT4/MT5 Broker
XM Broker
- Free $50 To Start Trading Instantly! (Withdraw-able Profit)
- Deposit Bonus up to $5,000
- Unlimited Loyalty Program
- Award Winning Forex Broker
- Additional Exclusive Bonuses Throughout The Year
- Exclusive 90% VIP Cash Rebates for all Trades!


Already an XM client but missing out on cashback? Open New Real Account and Enter this Partner Code: VIP90


