


The US major indices are stretching to the new session lows.
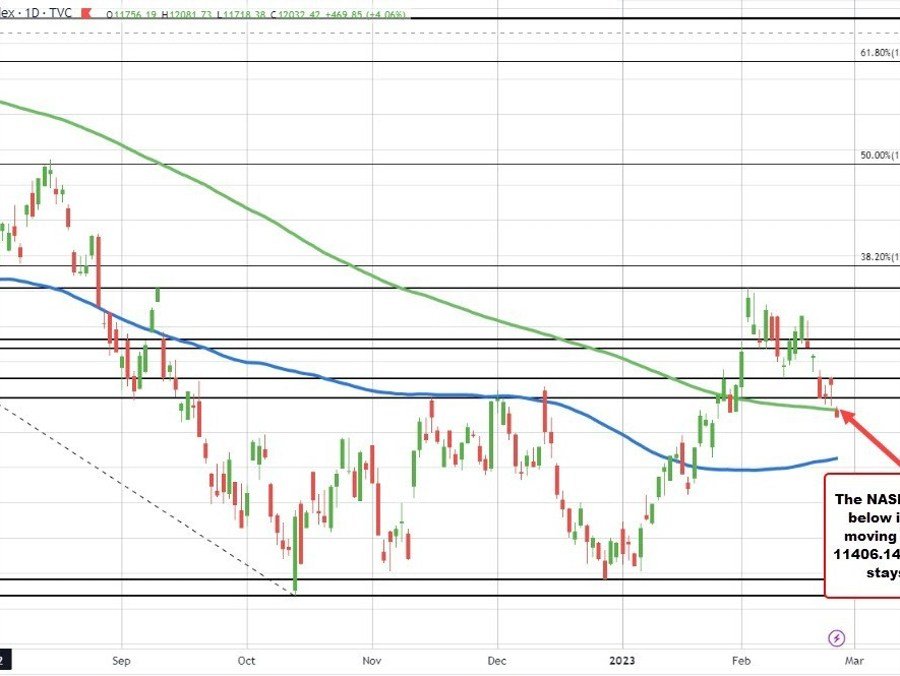
NASDAQ index below its 200 day moving average
The NASDAQ
NASDAQ
The Nasdaq Stock Market or NASDAQ is an American stock exchange. It trails only the New York Stock Exchange (NYSE) in market capitalization and is part of a network of stock markets and options exchanges.Launched back in 1971, NASDAQ is the acronym for the National Association of Securities Dealers Automated Quotations. Since then it is known simply as NASDAQ and has become one of the most influential exchanges worldwide.The NASDAQ was the world’s first electronic stock market, and has since ass
The Nasdaq Stock Market or NASDAQ is an American stock exchange. It trails only the New York Stock Exchange (NYSE) in market capitalization and is part of a network of stock markets and options exchanges.Launched back in 1971, NASDAQ is the acronym for the National Association of Securities Dealers Automated Quotations. Since then it is known simply as NASDAQ and has become one of the most influential exchanges worldwide.The NASDAQ was the world’s first electronic stock market, and has since ass
Read this Term index is down around -241.2 or -2.09% at 11348.99. The chart moved to the downside takes the price back below its 200 day moving average 11406.16.
Back on January 31 the price moved back above its 200 day moving average at 11486, and stayed above until today. The high price extended to 12266.41 before starting its retreat back to the downside on February 2 (the day before the US jobs report).
For the S&P index. It is currently trading down -64 points or -1.59% at 3948.13. The low price reached 3944.95 so far.
For it it is approaching its 200 day moving average at 3940.01. The price closed above its 200 day moving average on January 20 when the moving average
Moving average
A moving average is a statistical tool that is used to smooth out short-term fluctuations in data and reveal longer-term trends. It is calculated by taking the average of a certain number of data points over a specific period of time, and then plotting that average as a line on a chart. The most common types of moving averages are simple moving averages (SMA) and exponential moving averages (EMA).In financial markets, moving averages are often used to analyze stock prices, exchange rates, and ot
A moving average is a statistical tool that is used to smooth out short-term fluctuations in data and reveal longer-term trends. It is calculated by taking the average of a certain number of data points over a specific period of time, and then plotting that average as a line on a chart. The most common types of moving averages are simple moving averages (SMA) and exponential moving averages (EMA).In financial markets, moving averages are often used to analyze stock prices, exchange rates, and ot
Read this Term was at 3968.67. The high price extended to 4195.44 on February 2 before rotating to the downside. The price has as moved down in five of the last six trading days. That move took the price from a high of 4136.54 last Friday, to the low today of 3944.95. That is a decline over the five days of -4.63% (from the high to low).
On a move below the 200 day moving average, traders would target the 38.2% retracement of the move up from the October low at 3927, and the 100 day moving average at 3914.27. The price has closed above the 100 day moving average since January 6.
S&P index moves closer to its 200 day moving average
US yields still remain elevated but are marginally off their highs for the day:
- two year 4.792% +10 basis points
- five year 4.199% +9.4 basis points
- 10 year 3.937% +5.6 basis points


