


The GBPUSD has the rare instance where the price, and 100/200 day MA have converged (Threes company). The first test has seen a modest bounce off the moving average
Moving average
A moving average is a statistical tool that is used to smooth out short-term fluctuations in data and reveal longer-term trends. It is calculated by taking the average of a certain number of data points over a specific period of time, and then plotting that average as a line on a chart. The most common types of moving averages are simple moving averages (SMA) and exponential moving averages (EMA).In financial markets, moving averages are often used to analyze stock prices, exchange rates, and ot
A moving average is a statistical tool that is used to smooth out short-term fluctuations in data and reveal longer-term trends. It is calculated by taking the average of a certain number of data points over a specific period of time, and then plotting that average as a line on a chart. The most common types of moving averages are simple moving averages (SMA) and exponential moving averages (EMA).In financial markets, moving averages are often used to analyze stock prices, exchange rates, and ot
Read this Term levels (see post here and here).
That is not the only major pair with the “Threes Company” dynamic.
The NZDUSD breaks below the 100/200 day MAs
In the case of this currency pair, the price fell below the moving averages, corrected up to the levels and has continued its run to the downside. The low price has reached 0.61503. You can see the price action on the 5 minute chart above. The 100 and 200 day MAs are overlayed on that chart.
What now?
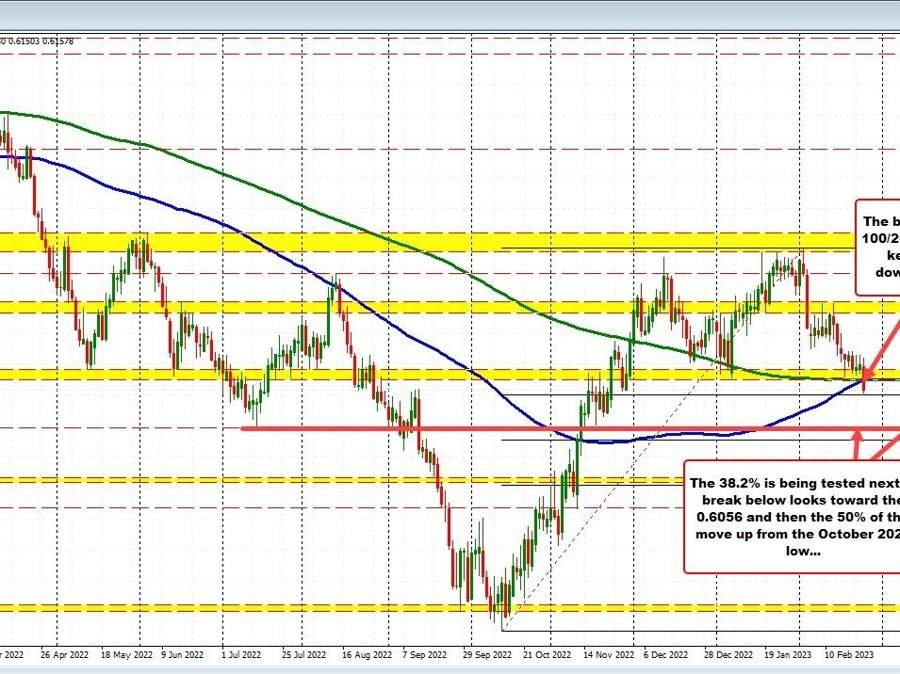
Looking at the daily chart below, the price is approaching the 38.2% of the move up from the October 2022 low. That level comes in at 0.61453 (the low reached 0.61503 so far). A move below that retracement would open the door for a move toward 0.6056 over times.
What traders who are short and looking for more downside, would not want to see is a move back above the 100/200 day MAs. That ship has sailed on the break. Moving back above would discourage the sellers looking for a more sustained tilt and move to the downside going forward.
NZDUSD falls below the 100/200 day MAs


