


NZDUSD trades in an up and down technical range
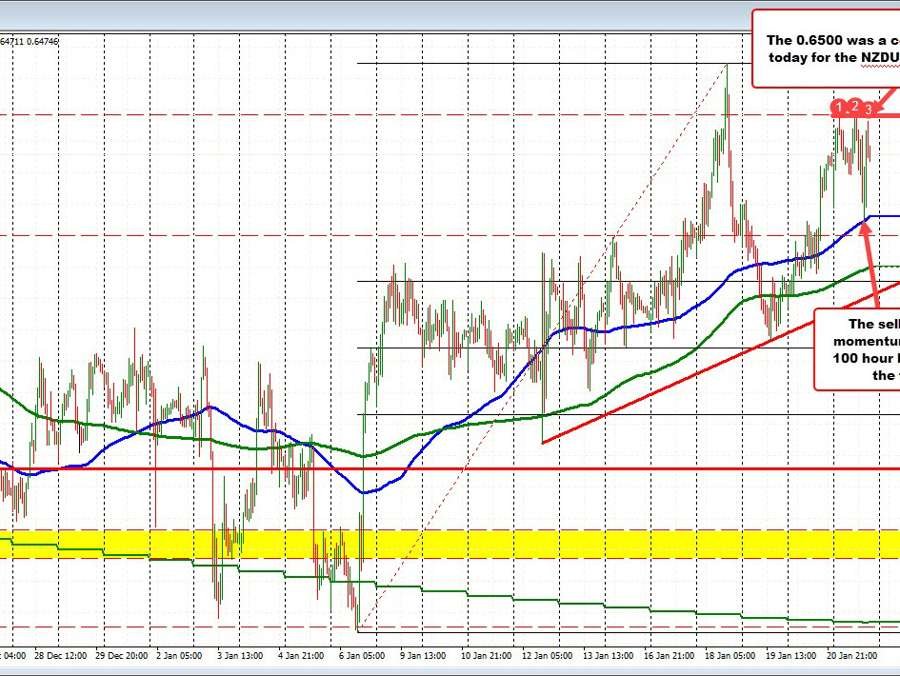
After moving up and down in a relatively narrow range in the Asian session, the pair turned more to the downside. The low price tested the rising 100 hour moving average
Moving average
A moving average is a statistical tool that is used to smooth out short-term fluctuations in data and reveal longer-term trends. It is calculated by taking the average of a certain number of data points over a specific period of time, and then plotting that average as a line on a chart. The most common types of moving averages are simple moving averages (SMA) and exponential moving averages (EMA).In financial markets, moving averages are often used to analyze stock prices, exchange rates, and ot
A moving average is a statistical tool that is used to smooth out short-term fluctuations in data and reveal longer-term trends. It is calculated by taking the average of a certain number of data points over a specific period of time, and then plotting that average as a line on a chart. The most common types of moving averages are simple moving averages (SMA) and exponential moving averages (EMA).In financial markets, moving averages are often used to analyze stock prices, exchange rates, and ot
Read this Term (blue line in the chart above) and found willing buyers against the risk defining level (the moving average is currently at 0.64377 in the the chart above).
The price then snapped back higher over the next hour or so of trading, and in the process moved back toward the highs for the day near 0.6498. The high price reached 0.64948 just short of the high (and the natural resistance at 0.6500 too). The price has since rotated back down toward 0.6475 currently with seller’s leaned against the prior highs.
What now?
With resistance up near the 0.6500 level, and support near the rising 100 hour moving average at 0.64377, those are the bookend levels to get to and through on more momentum to the upside, or to the downside. The closing level from Friday was near 0.6470. Perhaps moving below their level and staying below the level would help to give seller some added comfort/confidence.
But overall for the day, the buyers had a shot (above 0.6498), and the sellers had the shot (below the rising 100 hour moving average) and each of them could not muster a break. As a result, the extremes define the range, and traders will wait for the next break.
PS. Tomorrow the CPI for the 4Q will be released with the expectations of 1.4% (QoQ). That is lower than the 2.2% in the 3Q but at 1.4% it is still well elevated. The last 4 quarters have seen gains of 2.2%, 1.6%, 1.7% and 1.4% or 6.9% if you cumulate those QoQ gains. A 1.4% rise in the 4Q would still have the cumulated gain of 6.9% for the last 4 quarters – well above the 2% target.


