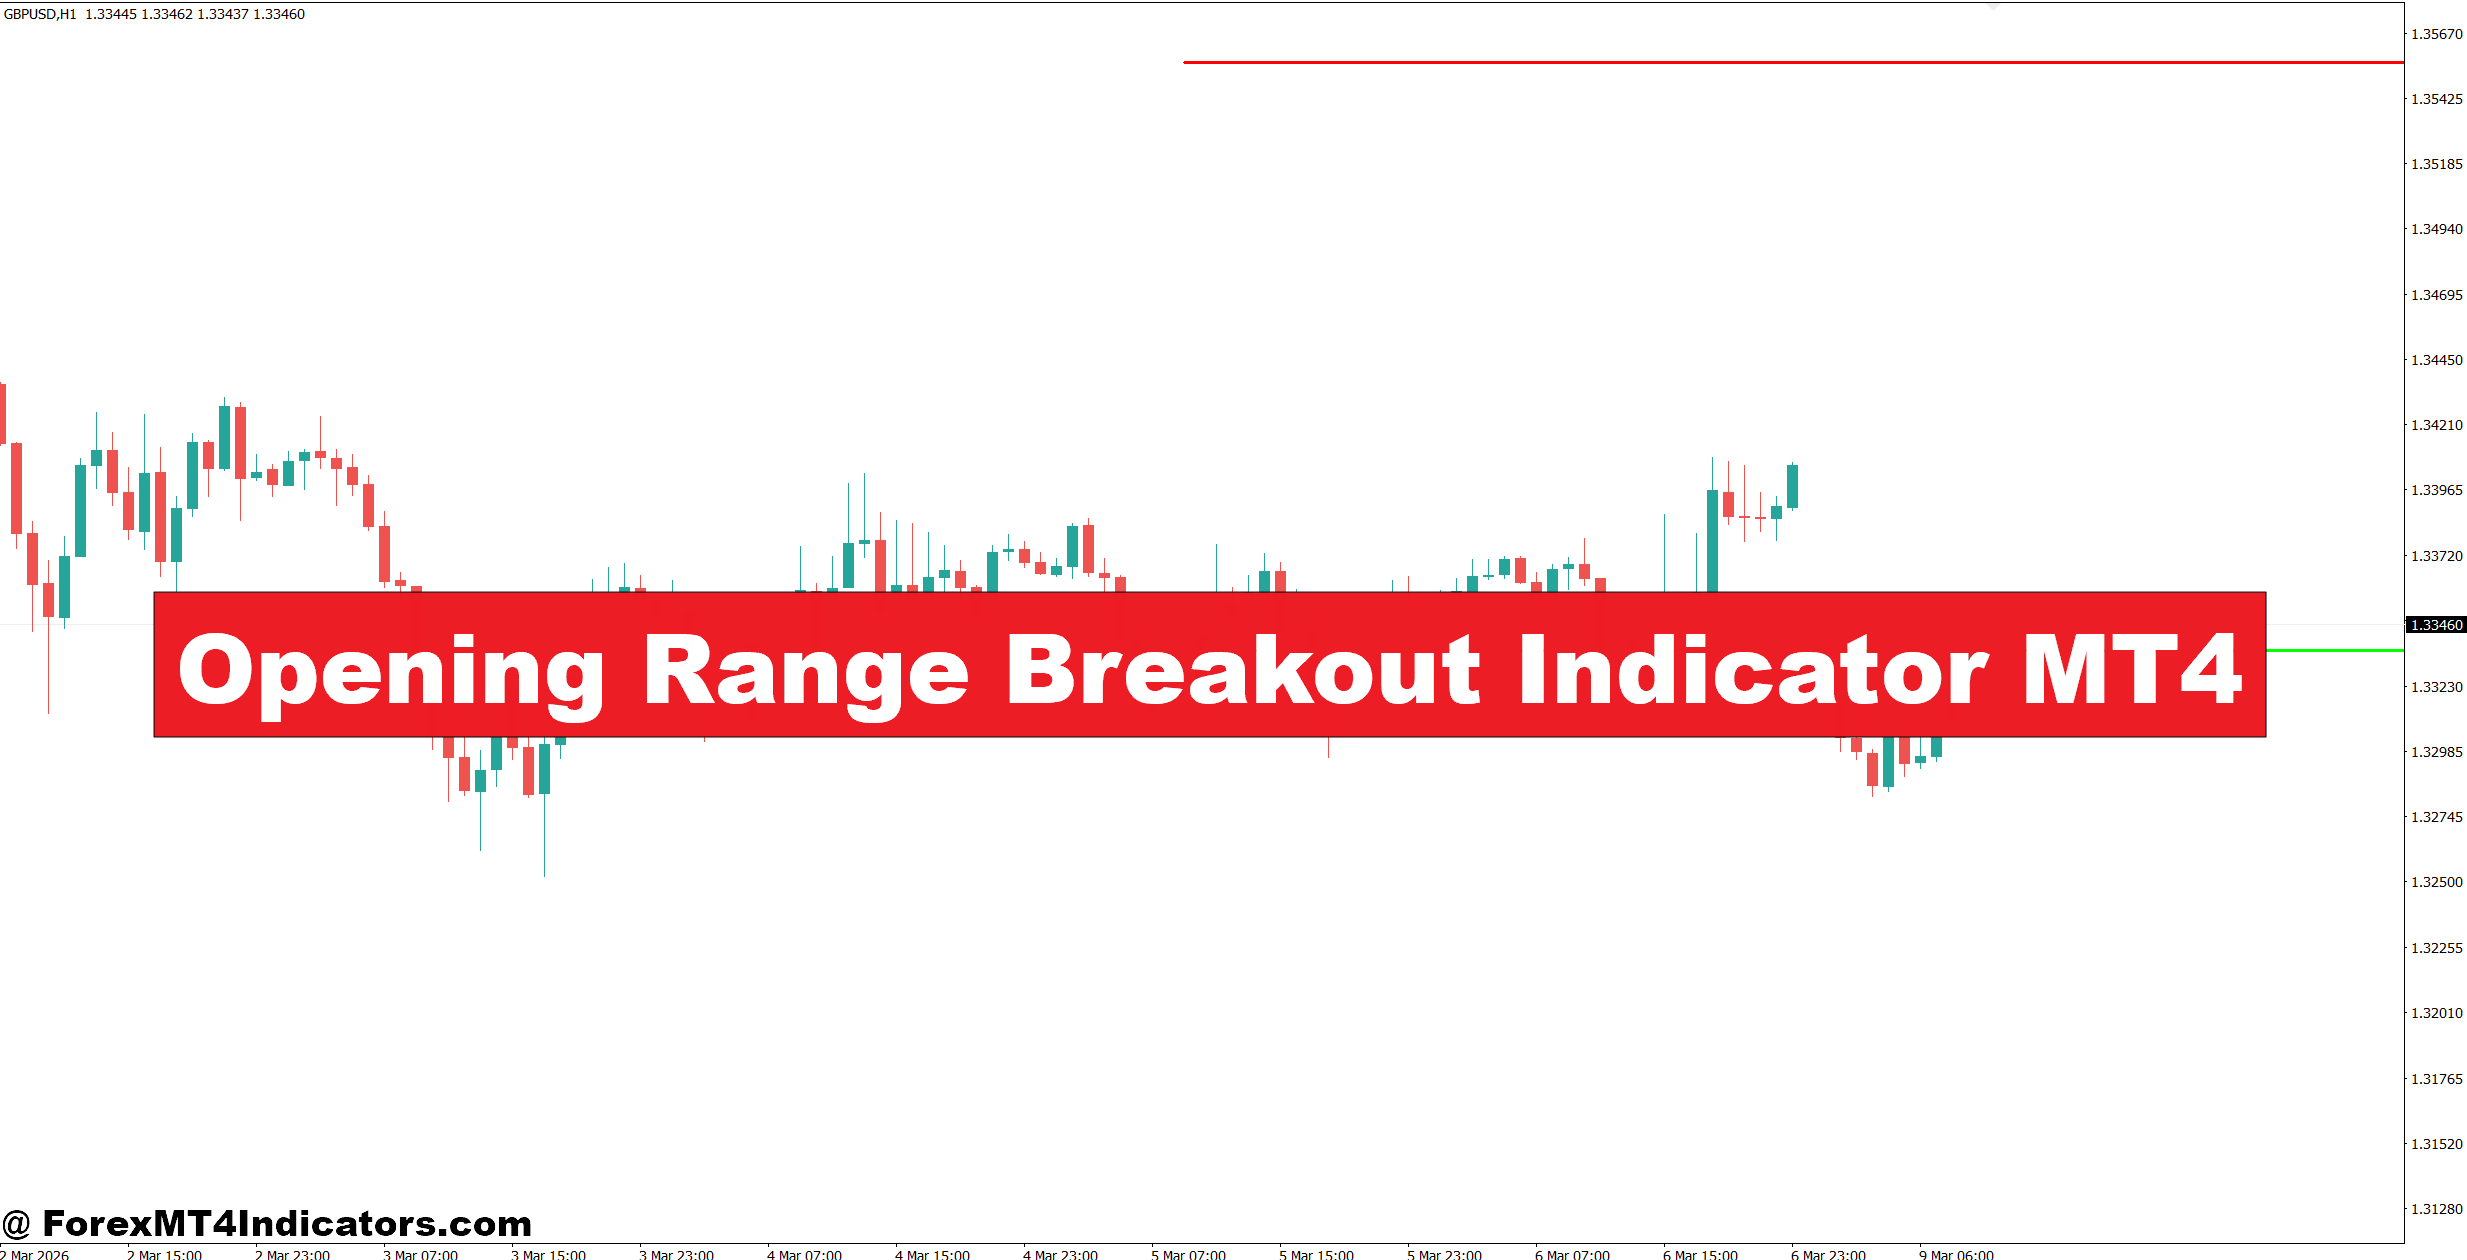
The Opening Range Breakout Indicator MT4 was designed to help solve that problem by marking the market’s opening range and highlighting possible breakout opportunities. Instead of guessing where momentum may begin, traders can focus on clearly defined price levels. That approach reduces emotional decisions and improves trade planning. While no indicator can predict every move, this tool gives traders a structured way to identify high-probability breakout setups. The sections below explain how the indicator works, how traders use it in live market conditions, and where it fits into a complete trading strategy.
What Is the Opening Range Breakout Indicator MT4?
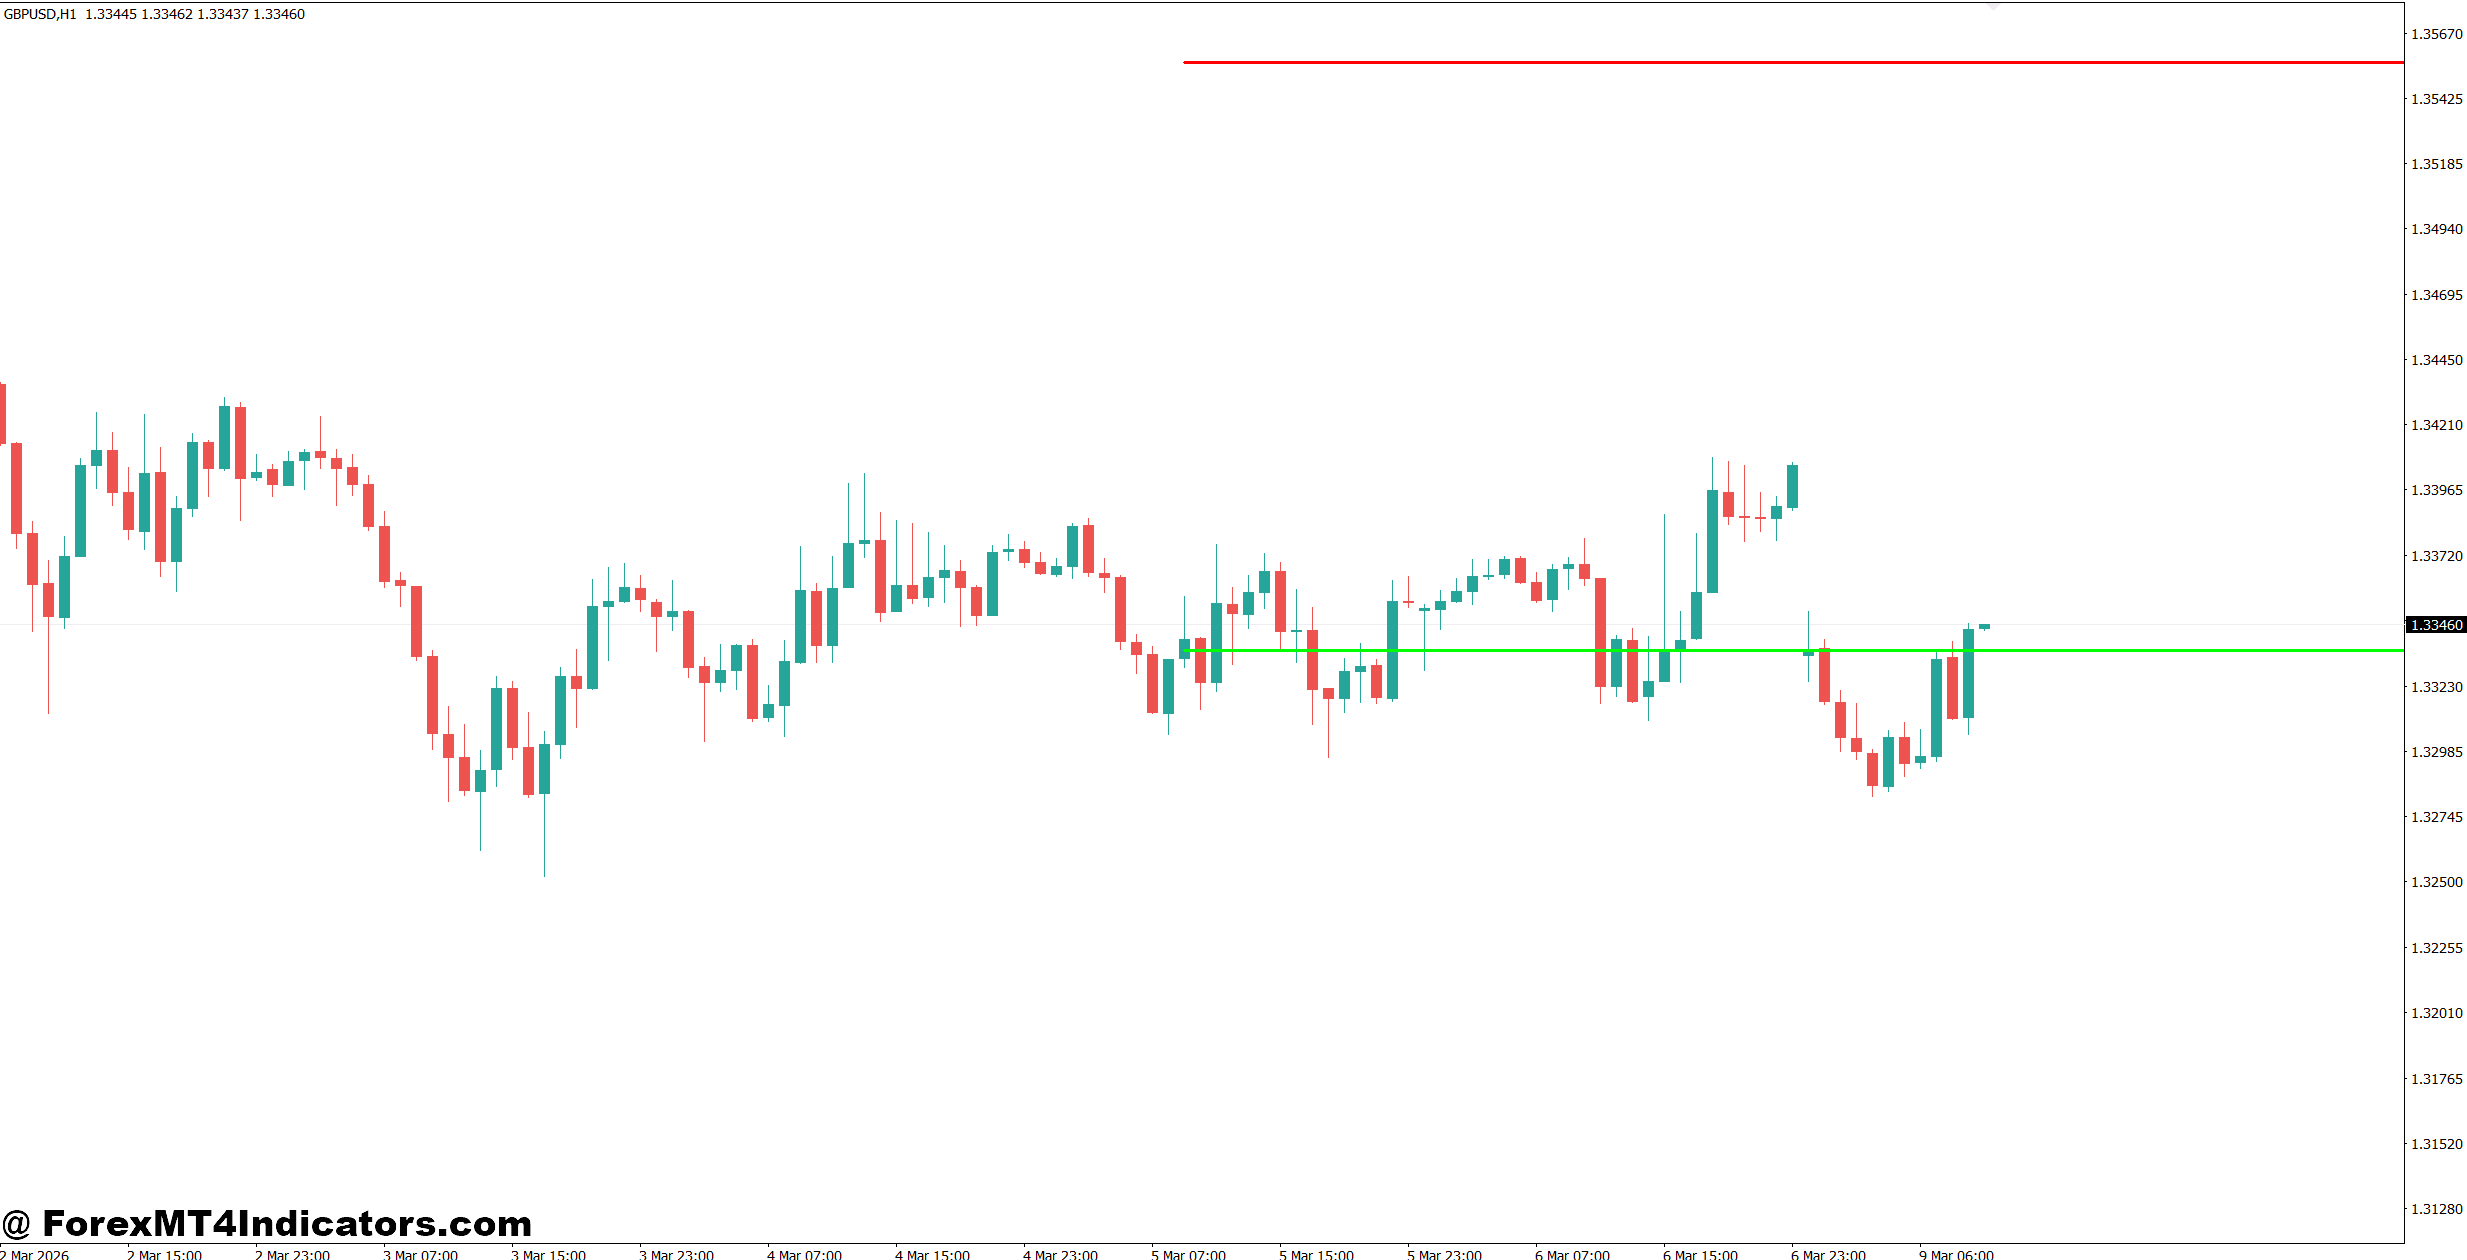
The Opening Range Breakout Indicator MT4 is a technical analysis tool that identifies the highest and lowest prices formed during a selected opening period. Most traders use the first 15, 30, or 60 minutes after the London or New York session begins. The indicator then draws horizontal levels that remain visible throughout the trading session.
These levels represent areas where buyers and sellers established early control. A breakout above the opening high often suggests bullish momentum, while a break below the opening low may signal increasing selling pressure.
Unlike traditional support and resistance lines that rely on historical swing points, the opening range updates each trading day. This makes it especially useful for day traders who focus on fresh market activity rather than older price zones.
Many traders combine this indicator with trend analysis, moving averages, or volume confirmation before entering a position.
How the Indicator Works in Live Market Conditions
The indicator measures the highest and lowest prices during the chosen opening period. Once that period closes, the range becomes fixed, allowing traders to monitor future price action around those boundaries.
For example, EUR/USD opens the London session with a 28-pip range between 1.1018 and 1.1046 during the first 30 minutes. Later, price closes above 1.1046 with a strong bullish candle while the 50 EMA also points upward. That combination often provides a stronger buying signal than a breakout alone.
But not every breakout succeeds.
When testing this on volatile NFP days, many traders notice that the first breakout frequently reverses within minutes. Waiting for the breakout candle to close outside the range or looking for a retest often removes several low-quality entries.
Another practical example appears on GBP/USD using the 15-minute chart. After the New York session begins, price breaks below the opening range by nearly 20 pips before retesting the lower boundary. Sellers who enter after the retest often experience better risk-to-reward opportunities than traders chasing the initial move.
False breakouts remain common during quiet Asian trading hours. Because of that, many experienced traders avoid relying on the indicator outside active market sessions.
Using the Opening Range Breakout Indicator in Real Trading
Trend Confirmation Improves Accuracy
Many traders avoid taking every breakout signal. Instead, they compare the breakout direction with the overall market trend.
Suppose USD/JPY trades above the 200 EMA on the 1-hour chart. If the opening range breaks upward during the London session, the trade aligns with the larger trend. That usually produces more reliable setups than trading against the prevailing direction.
Stop Loss and Profit Targets
Risk management matters more than finding perfect entries.
A common approach places the stop loss 10 to 15 pips beyond the opposite side of the opening range. Profit targets often use a minimum 1:2 risk-to-reward ratio.
For example:
- Entry: Buy at 1.2150
- Stop Loss: 1.2128 (22 pips)
- Take Profit: 1.2194 (44 pips)
This structure allows traders to remain profitable even if only half of their trades succeed.
Trading forex carries substantial risk. No indicator guarantees profits.
Best Market Conditions
The indicator performs best when volatility expands after major market opens or important economic releases.
It generally works well during:
- London Open
- New York Open
- Interest rate announcements
- Strong trending markets
It tends to struggle during:
- Low-volatility sessions
- Holiday trading
- Sideways markets with frequent whipsaws
- Extremely wide spreads
Recognizing these conditions often makes a bigger difference than changing indicator settings.
Settings, Customization, and Comparison with Similar Indicators
Most versions of the Opening Range Breakout Indicator MT4 allow traders to customize several settings.
Common adjustments include:
- Opening range duration (15, 30, or 60 minutes)
- Session selection (London, New York, Tokyo)
- Line colors and thickness
- Alert notifications
- Time zone offset
Scalpers often prefer a 15-minute opening range because it creates earlier trading opportunities. Swing traders usually select 30 or 60 minutes to filter out market noise.
What makes this indicator different from a Donchian Channel?
A Donchian Channel continuously updates its highest and lowest prices over a chosen period, such as 20 candles. The Opening Range Breakout Indicator fixes its levels after the opening session ends. That creates stable reference points for the rest of the trading day.
Compared with Bollinger Bands, the Opening Range Breakout Indicator focuses on price expansion from a defined session rather than volatility measurements. Bollinger Bands react continuously to changing market conditions, while the opening range stays unchanged until the next trading session.
Compared with Pivot Points, the indicator reflects current market participation instead of calculations based on the previous day’s high, low, and close.
That difference gives active day traders fresh levels based on today’s order flow rather than yesterday’s price action.
Still, experienced traders rarely rely on the indicator alone. Combining it with support and resistance zones, candlestick confirmation, and market structure usually produces stronger trade decisions.
How to Trade with Opening Range Breakout Indicator MT4
Buy Entry
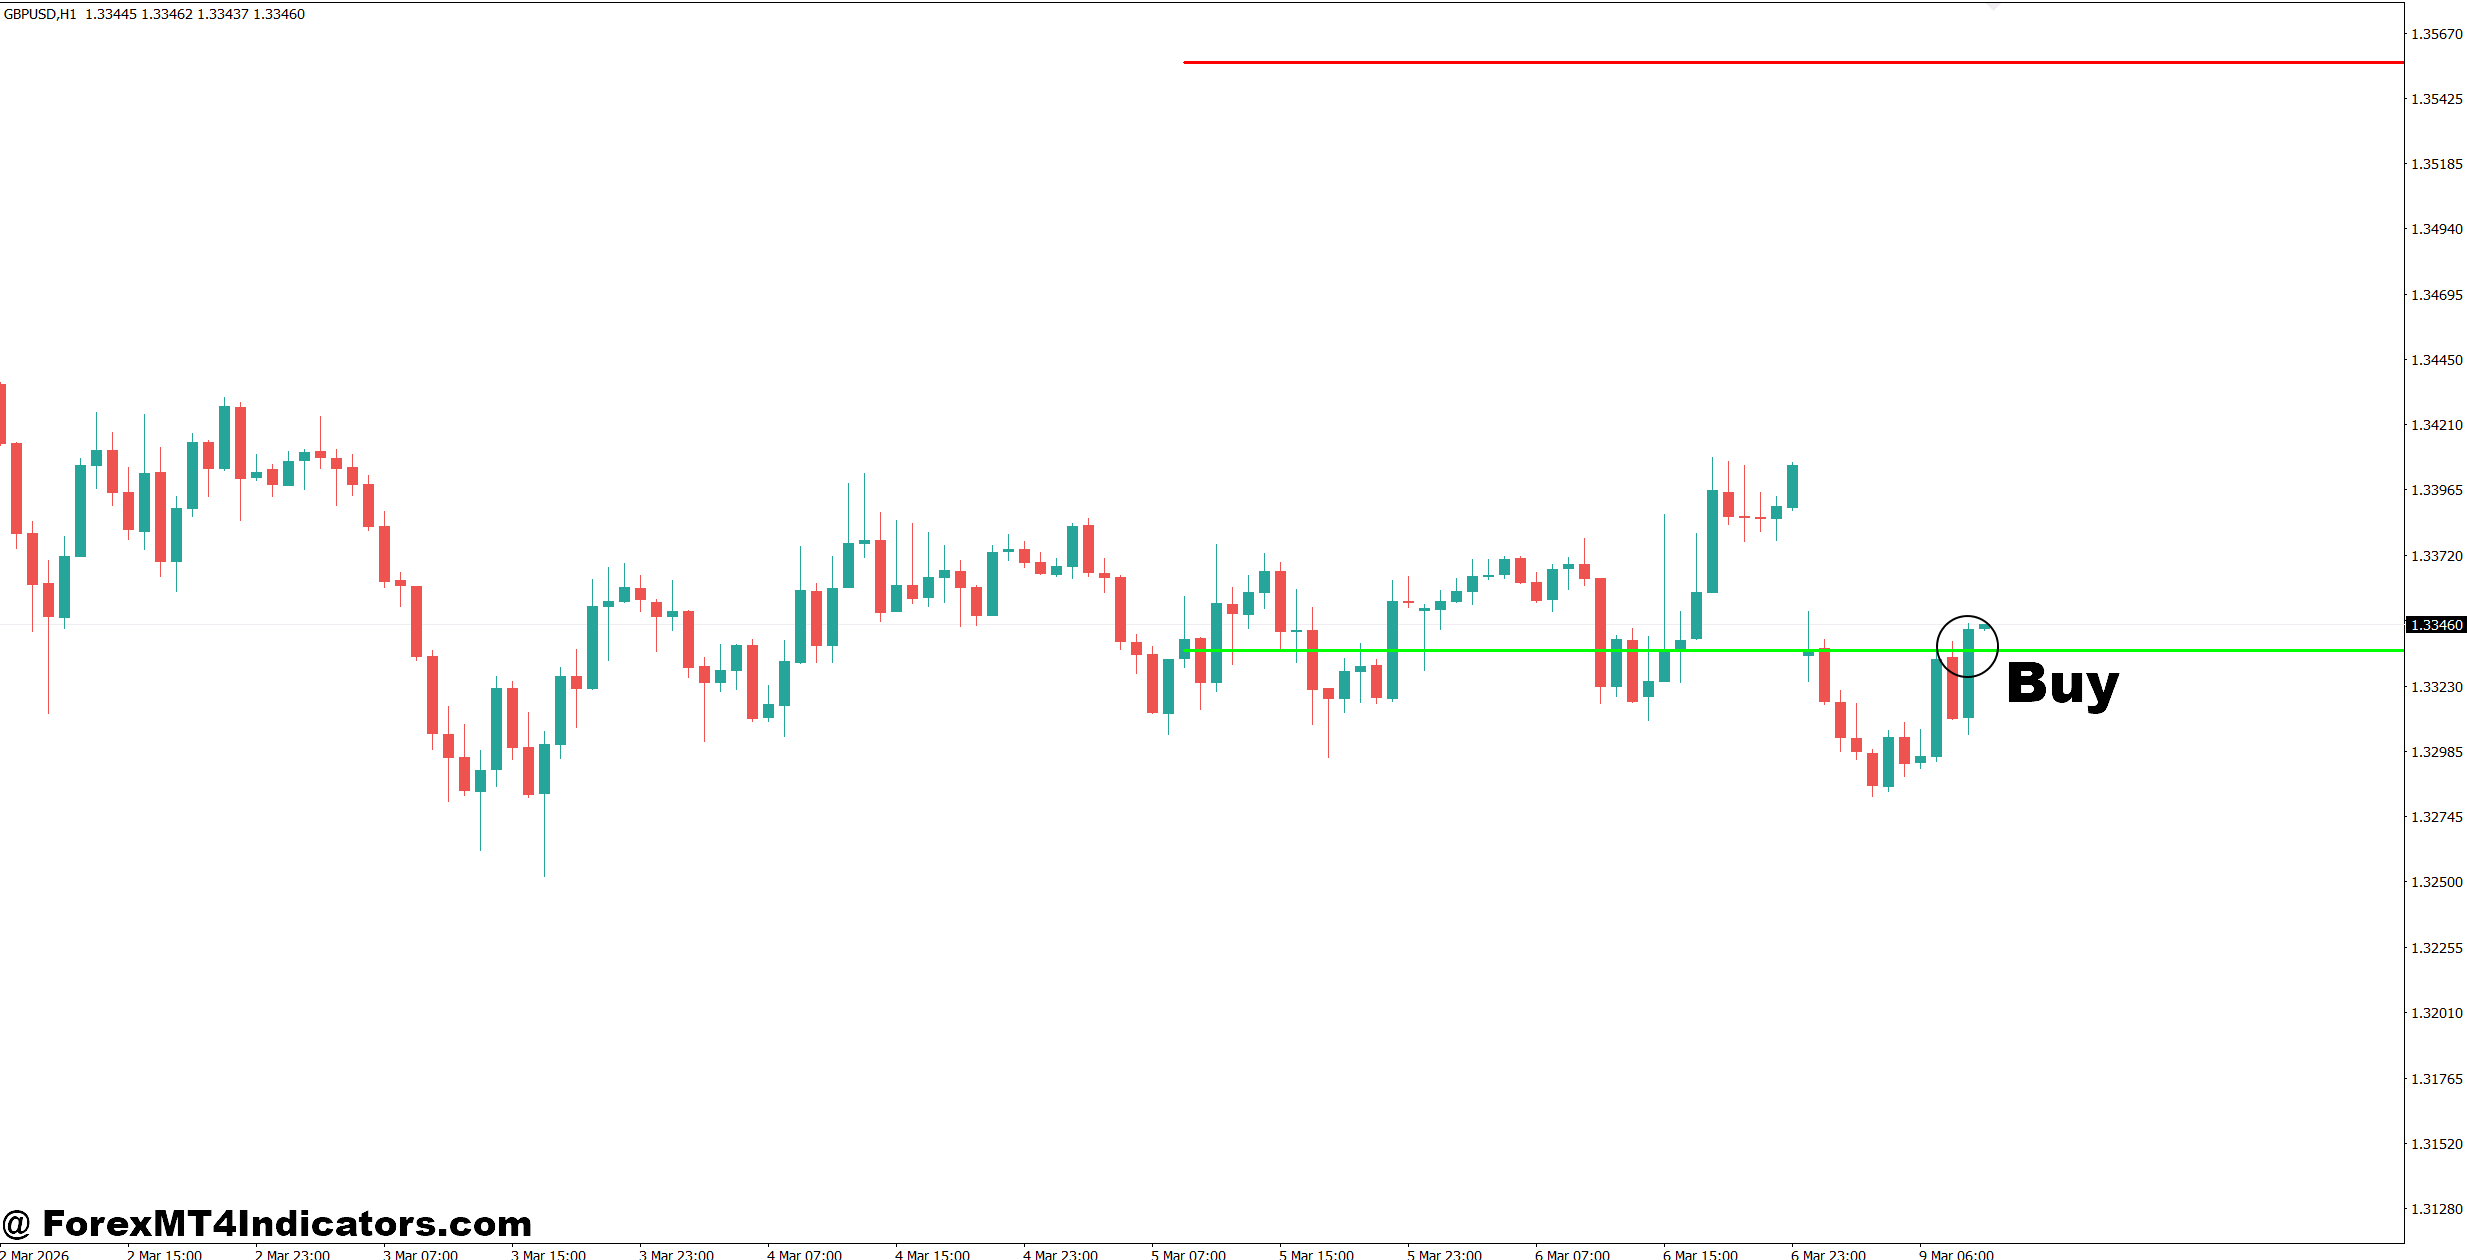
- Wait for an upside breakout – Buy after price closes 10-15 pips above the opening range on the 1-hour EUR/USD chart.
- Confirm with trend direction – Only buy if price stays above the 50 EMA on the 1-hour or 4-hour timeframe.
- Enter after a retest – Wait for price to retest the breakout level before entering to reduce fake-outs.
- Use strong bullish candles – Enter when a bullish candle closes outside the range with solid momentum.
- Place a tight stop-loss – Keep the stop 10-20 pips below the breakout level to manage risk.
- Target higher reward – Aim for at least a 1:2 risk-to-reward ratio or 30-60 pips profit.
- Trade active sessions – Focus on London or New York session breakouts for better volatility.
- Skip weak markets – Don’t buy when EUR/USD is moving sideways inside a 20-pip range.
Sell Entry
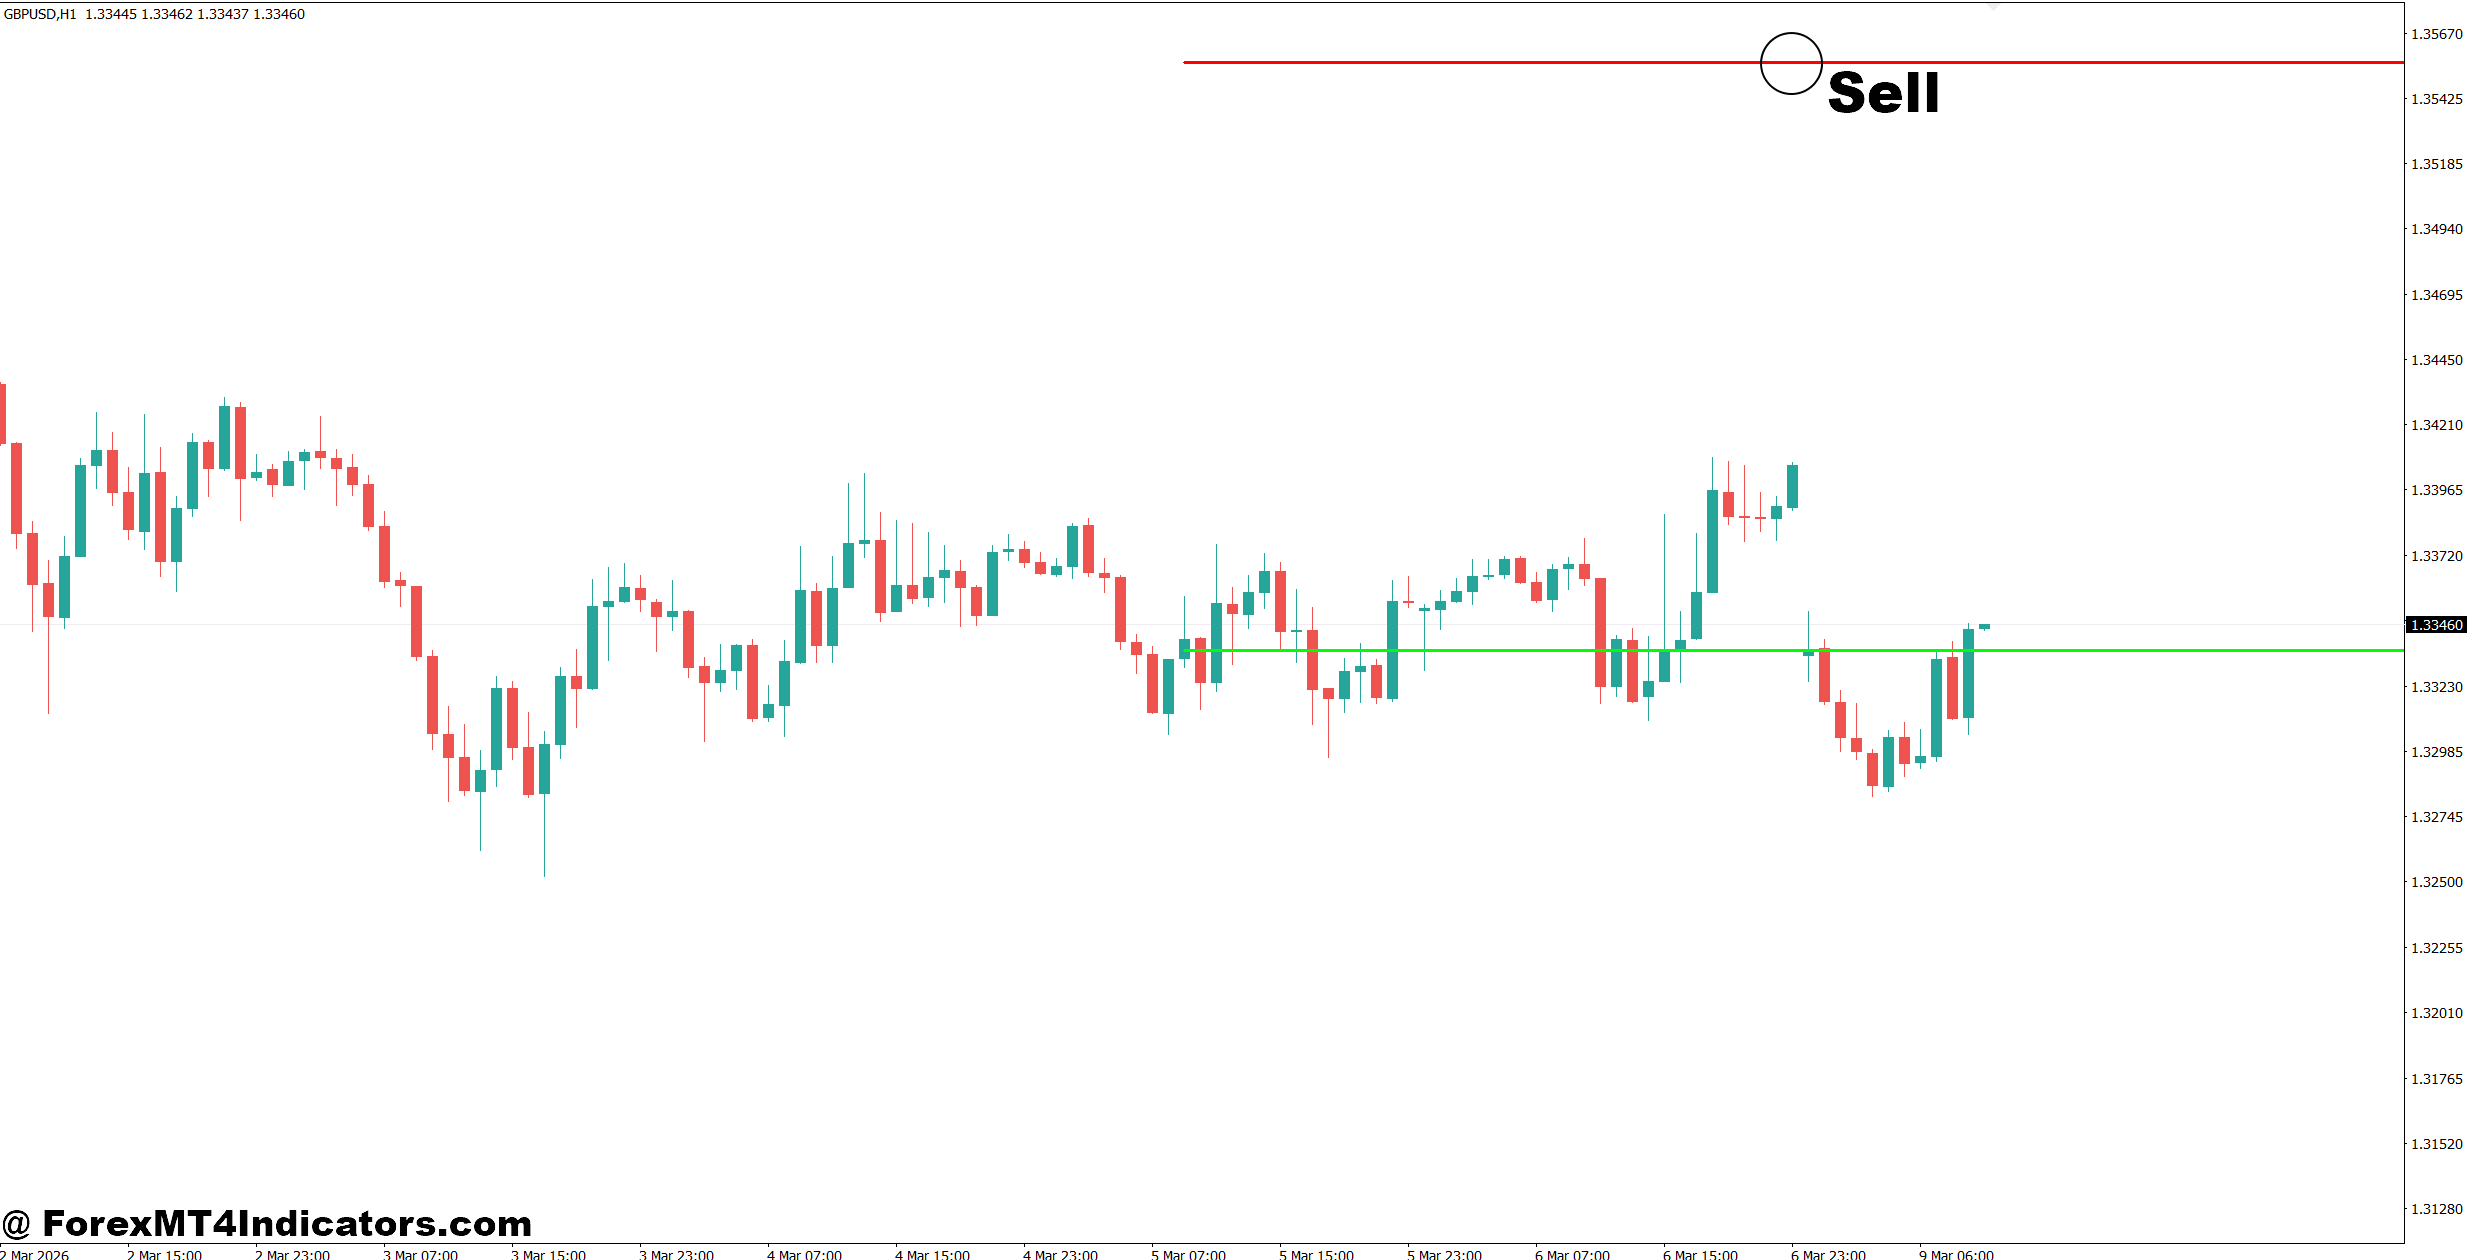
- Wait for a downside breakout – Sell after price closes 10-15 pips below the opening range on GBP/USD or EUR/USD.
- Follow the main trend – Take sell trades only when price remains below the 50 EMA on the 4-hour chart.
- Sell after a pullback – Enter when price retests the broken support and forms a bearish rejection candle.
- Confirm bearish momentum – Look for large bearish candles breaking the opening range with strong follow-through.
- Protect every trade – Place the stop-loss 10-20 pips above the breakout level.
- Set realistic targets – Target 40-80 pips on the daily trend or maintain a 1:2 risk-to-reward ratio.
- Trade high-volume sessions – Look for sell setups during the London or New York session for stronger moves.
- Avoid major news spikes – Don’t sell just before high-impact events like NFP or interest rate decisions because false breakouts are common.
Final Thoughts
The Opening Range Breakout Indicator MT4 gives traders a simple framework for identifying potential breakout opportunities during the most active trading sessions. It defines clear entry zones, helps organize stop-loss placement, and works well alongside trend confirmation and price action analysis. At the same time, traders should remember that false breakouts remain part of the market, especially during low-volume conditions or major news events. A disciplined approach, realistic risk management, and proper testing on pairs like EUR/USD, GBP/USD, and USD/JPY often produce better long-term results than relying on any single indicator. Used wisely, the Opening Range Breakout Indicator MT4 can become a valuable part of a balanced forex trading strategy rather than the entire strategy itself.
Recommended MT4/MT5 Broker
XM Broker
- *FREE $50 To Start Trading Instantly! (Withdraw-able Profit)
- Deposit Bonus up to $5,000
- Unlimited Loyalty Program
- Award Winning Forex Broker
- Additional Exclusive Bonuses Throughout The Year

>> Sign Up for XM Broker Account here <<