






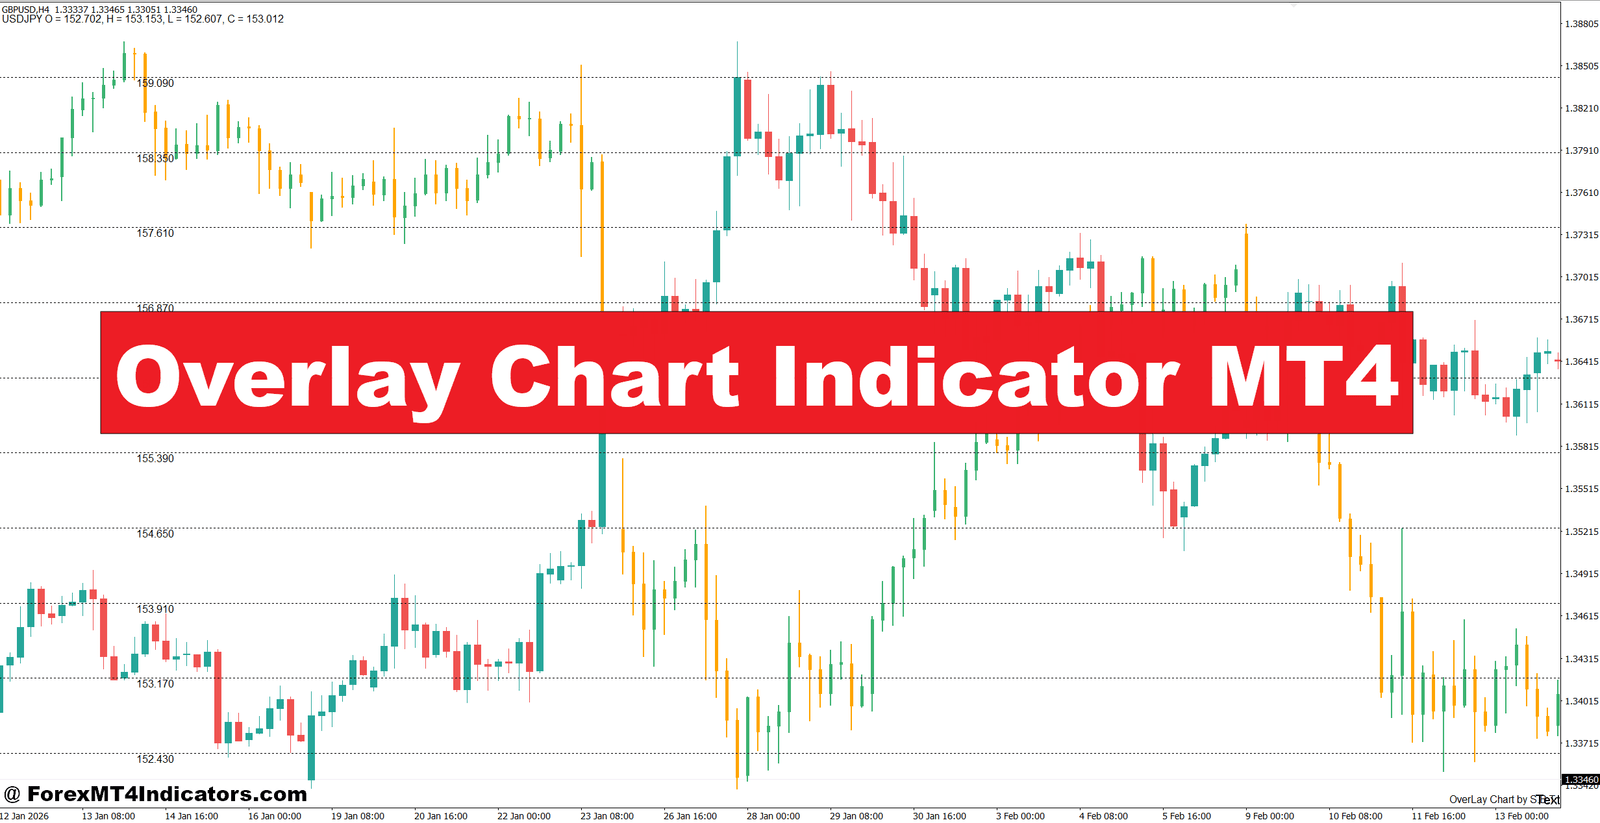
The Overlay Chart Indicator MT4 places the price movement of one instrument over another chart. Depending on the indicator version, the secondary symbol may be scaled, shifted, or normalized so its movement can be compared with the main symbol.
For example, a trader can place EUR/USD on the chart and overlay GBP/USD. Both instruments will then appear in the same price window. The trader can see whether they are moving together, separating, or changing direction at different speeds.
This approach is useful because currency pairs often share common drivers. EUR/USD and GBP/USD frequently respond to movements in the U.S. dollar, while USD/JPY can react strongly to changes in U.S. yields and broader risk sentiment.
The indicator doesn’t predict the next candle. It simply makes comparative price analysis faster.
How the Overlay Chart Works in MT4
The basic logic is straightforward. The indicator reads historical price data from the selected secondary symbol and plots that data on the active chart. Since two instruments usually trade at very different price levels, the secondary series may need normalization or scaling before both lines can be displayed clearly.
A simple comparison might use percentage change from a starting point:
Percentage Change = ((Current Price − Starting Price) / Starting Price) × 100
Suppose EUR/USD rises from 1.1000 to 1.1055. That’s a 0.50% increase. If GBP/USD moves from 1.2700 to 1.2763 during the same period, it has also gained about 0.50%. The two markets are therefore showing similar short-term strength.
But imagine EUR/USD climbs 0.50% while GBP/USD gains only 0.15%. That gap may suggest weaker relative momentum in GBP/USD.
A trader watching market structure can then ask a more useful question: is the difference temporary, or is one market beginning to break away?
A Practical H1 Example
Consider EUR/USD on the 1-hour chart. Price breaks above resistance at 1.0850 and reaches 1.0880, creating a 30-pip move.
The trader overlays GBP/USD and notices that GBP/USD also breaks its nearby resistance instead of falling. That second confirmation supports the idea that broad dollar weakness may be driving both pairs.
A stronger setup could involve waiting for EUR/USD to retest 1.0850 and hold it as support. If the retest produces a bullish candle and GBP/USD remains firm, the trader has more evidence for a continuation entry.
The overlay does not create the trade by itself. Price structure still matters.
Settings and Timeframe Adjustments
The best settings depend on the purpose of the comparison. A trader studying short-term momentum may use the 15-minute or 1-hour chart, while someone analyzing broader market relationships may prefer the 4-hour or daily timeframe.
Several settings deserve attention:
- Secondary Symbol – Select the currency pair or market that needs comparison, such as GBP/USD, USD/JPY, or XAU/USD.
- Price Scaling – Normalization or scaling helps instruments with different price levels appear meaningfully together.
- Lookback Period – A 20- to 50-bar comparison can work for short-term analysis, while 100-200 bars gives a broader view.
- Line Style – A clearly different line makes the secondary instrument easier to identify.
- Timeframe – Matching the overlay timeframe with the main chart usually provides the cleanest comparison.
For EUR/USD on H1, a trader might begin with a 50-bar lookback. On a daily chart, 100 or 200 bars can provide a better view of longer-term relative movement.
The indicator should also be tested on the specific pair before being added to a live strategy. Correlations can weaken or reverse as monetary policy, economic data, and market sentiment change.
Using Overlay Analysis With Price Action

The strongest use case is confirmation.
Suppose USD/JPY is trading near 150.00 on the 4-hour chart. Price breaks below 149.50 support, but the trader wants additional evidence before selling. An overlay of another dollar-related pair may show broad dollar weakness at the same time.
If USD/JPY then retests 149.50 and fails, the setup becomes more interesting. A stop could be placed above the recent swing high, while the first target might sit 30-50 pips lower depending on volatility and structure.
The opposite can happen during a fake-out. If USD/JPY breaks support but the comparison market shows strong dollar demand, the trader may avoid entering immediately.
This is where the tool can save trades rather than create them.
During volatile NFP sessions, for instance, an overlay can become noisy because currency pairs may move several dozen pips within minutes. A trader should wait for the first reaction to settle instead of treating every sharp cross as a signal.
Advantages, Limitations, and Similar Tools
One major advantage is speed. Traders can compare related instruments without constantly opening several charts. It can also expose divergence that is easy to miss when markets are viewed separately.
Another benefit is flexibility. The same concept can be applied to forex pairs, commodities, indices, or other instruments available through the MT4 broker.
Still, there are limitations. Correlation does not mean causation. Two markets can move together for months and then separate suddenly. An overlay can also become misleading when scaling is poor or when the selected instruments have very different volatility profiles.
Compared with a correlation indicator, the Overlay Chart Indicator gives a more visual view of actual price movement. A correlation coefficient provides a numerical relationship, while the overlay shows where the movements diverge.
Compared with moving averages, it answers a different question. A 50-period moving average studies the trend of one instrument, whereas an overlay helps compare that instrument with another market.
Compared with RSI, the difference is even clearer. RSI measures momentum within one market. An overlay focuses on relative movement between markets.
That makes it a useful addition to support and resistance, moving averages, market structure, and momentum analysis—not a replacement for them.
How to Trade with Overlay Chart Indicator MT4
Buy Entry

- Wait for bullish overlay confirmation – Look for the main pair and comparison pair rising together on the 1-hour chart before considering a BUY.
- Buy after a 20–30 pip breakout – Enter EUR/USD after price breaks resistance by at least 20 pips and the overlay confirms stronger upside momentum.
- Confirm the retest – After a breakout, wait for a successful retest of the broken level on H1 before entering.
- Check GBP/USD strength – A bullish EUR/USD setup is stronger when GBP/USD also holds above support or gains around 0.20%–0.40%.
- Use H4 for trend direction – Prefer BUY trades when the 4-hour structure shows higher highs and higher lows.
- Set a 15–25 pip stop – Place the stop below the recent swing low, adjusting for pair volatility rather than using a fixed distance.
- Target at least 1:2 risk-reward – With a 20-pip stop, aim for roughly 40 pips or more when nearby resistance allows.
- Avoid weak confirmation – Don’t BUY when EUR/USD rises but the overlay pair falls sharply or shows a bearish divergence.
Sell Entry

- Wait for bearish overlay confirmation – Consider a SELL when both the main and comparison pairs weaken on the 1-hour chart.
- Sell after a 20–30 pip breakdown – Enter EUR/USD after support breaks by at least 20 pips and the overlay supports downside momentum.
- Confirm the failed retest – Let price retest broken support and reject it before opening the SELL position.
- Check GBP/USD weakness – A bearish EUR/USD signal gains strength when GBP/USD also falls around 0.20%–0.40% from resistance.
- Use H4 trend structure – Favor SELL setups when the 4-hour chart forms lower highs and lower lows.
- Protect with a 15–25 pip stop – Place the stop above the latest swing high and increase it if H1 volatility is unusually high.
- Aim for a 1:2 risk-reward ratio – A 25-pip stop should ideally support a target near 50 pips or more.
- Avoid conflicting signals – Don’t SELL when the main pair breaks support but the overlay market remains strongly bullish or the daily trend points higher.
Final Takeaway
The Overlay Chart Indicator MT4 is most useful when traders need a faster way to compare markets. Its main strengths are straightforward: it can reveal relative strength, highlight divergence, and provide confirmation around important price levels.
Traders can start with a 20- to 50-bar lookback for intraday charts and expand the period for higher timeframes. A setup becomes more credible when the overlay agrees with a clear breakout, retest, or market-structure shift.
Still, the indicator has limits. Correlations change, volatile sessions can create misleading movement, and visual comparison doesn’t guarantee a profitable trade.
Trading forex carries substantial risk. No indicator guarantees profits.
The practical next step is simple: test the tool on a few liquid pairs, record where the overlay confirms or contradicts price action, and judge its value from actual results rather than attractive chart signals.
Level up your trading
Learn to read the chart — not just the indicator
eBook · Instant PDF
The Candlestick Playbook
Read and trade 40+ candlestick patterns — with exact entries, stops and exits.
Video Course · 12 modules
The Price Action Masterclass
Read clean charts the no-indicator way — pin bars, support & resistance, entries and exits.
Recommended MT4/MT5 Brokers
XM
- ✓ *FREE *$50 to start (withdrawable)
- ✓ Deposit bonus up to $5,000
- ✓ Negative balance protection
Trading forex and CFDs carries a significant risk of loss and is not suitable for everyone. Broker links are affiliate links — we may earn a commission at no cost to you.
Free MT4 Indicator Download


