


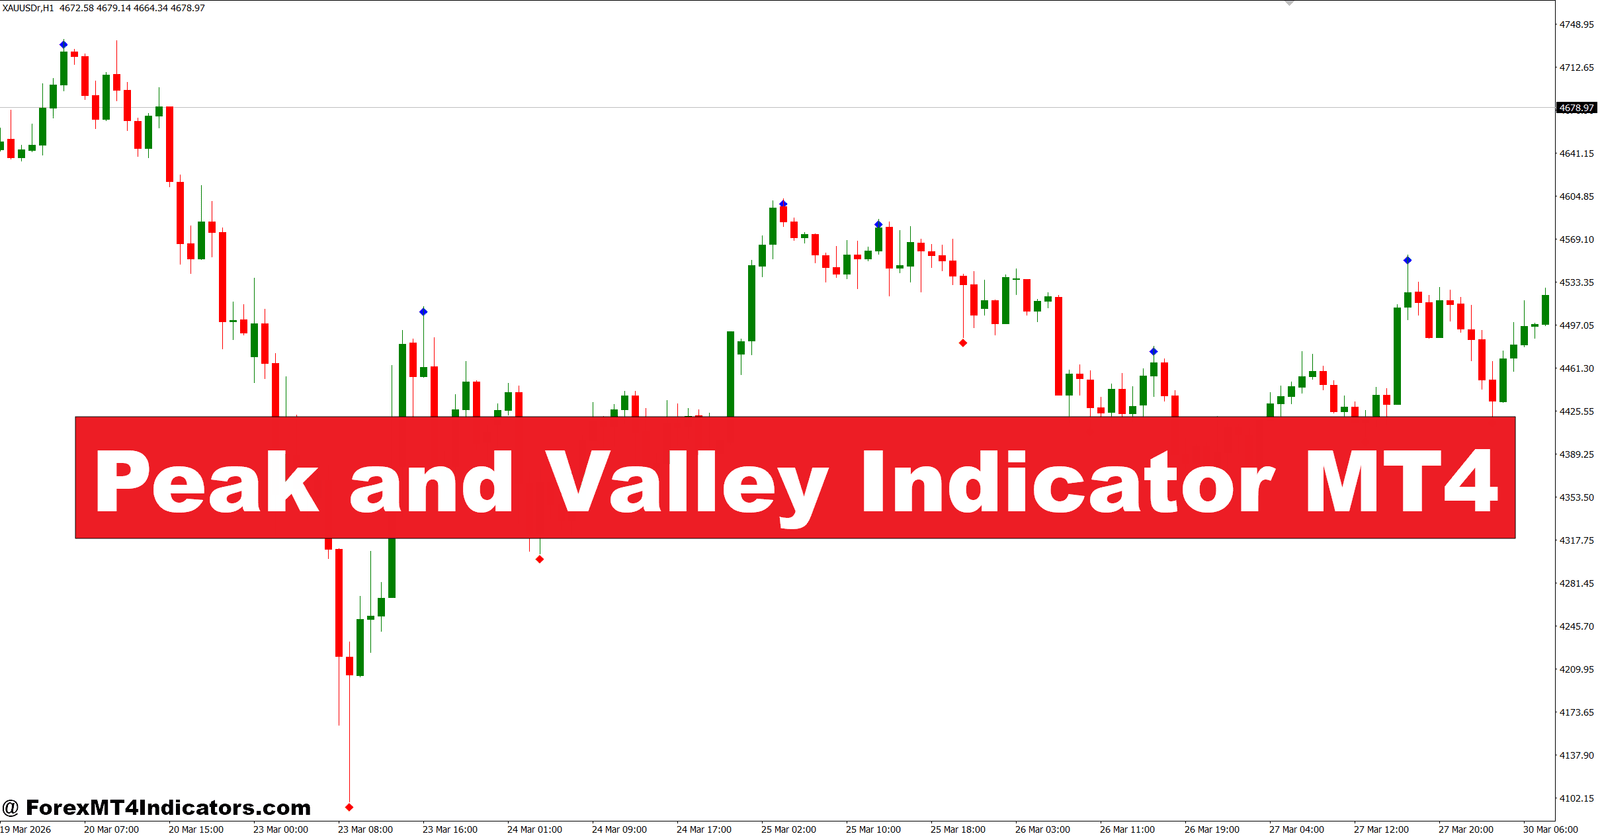
The Peak and Valley Indicator MT4 helps reduce that uncertainty by highlighting important turning points that often shape market structure.
Poor timing can lead to repeated stop-loss hits, emotional trading, and unnecessary account drawdowns. Many traders react to every candle instead of waiting for confirmed price swings, which often results in chasing the market. This indicator gives traders a clearer view of where significant peaks and valleys have formed, making trend analysis and trade planning much more organized.
The sections below explain how the indicator works, where it performs best, and how traders can combine it with price action to improve trading decisions.
Understanding the Peak and Valley Indicator MT4
The Peak and Valley Indicator MT4 is a swing detection tool that marks local highs (peaks) and local lows (valleys) directly on the chart. Instead of predicting future price movement, it identifies completed swing points after price has confirmed a reversal.
Most versions of the indicator analyze a selected number of candles before and after a price point. If the current high is greater than nearby highs, it becomes a peak. If the current low is lower than surrounding lows, it becomes a valley. This filtering process removes much of the small market noise that appears during sideways trading.
Many traders use these swing points to:
- Identify trend direction.
- Draw support and resistance levels.
- Spot higher highs and higher lows.
- Recognize lower highs and lower lows.
- Measure recent market momentum.
For example, GBP/USD on the 4-hour chart may print consecutive higher valleys while each new peak moves above the previous one. That structure often confirms buyers remain in control even during temporary pullbacks.
How the Indicator Calculates Swing Points

The indicator follows a simple but effective logic. It compares each candle with neighboring candles over a chosen lookback period. A peak appears only when the selected candle’s high stands above nearby highs. A valley forms only when its low is lower than surrounding lows.
Because future candles help confirm the swing, some signals appear with a slight delay. That’s normal and helps reduce fake turning points.
Here’s a practical example.
On EUR/USD’s 1-hour chart, price rallies from 1.0950 to 1.1015 before pulling back to 1.0980. Once several candles confirm that 1.1015 remains the highest point, the indicator marks it as a peak. If price later creates a valley at 1.0980 and then breaks above 1.1015, many traders see that as a continuation signal rather than an early reversal.
When testing this during volatile NFP days, traders often notice that smaller swing points disappear as volatility expands. Waiting for the candle close before reacting usually prevents unnecessary entries during fast price spikes.
The indicator works best when combined with:
- Trendlines
- Moving averages
- RSI divergence
- Support and resistance zones
- Fibonacci retracement levels
Trading forex carries substantial risk. No indicator guarantees profits.
Applying the Indicator in Live Trading
Swing points become much more valuable when they match the overall market structure.
Imagine USD/JPY trading above the 200-period Exponential Moving Average on the 1-hour chart. Price pulls back roughly 45 pips before the Peak and Valley Indicator MT4 marks a fresh valley. Buyers step in near that level, and the next bullish candle closes above the previous candle’s high. Some traders use this combination as a potential long setup with a stop-loss 15-20 pips below the valley and an initial target near the previous peak.
The opposite approach works during bearish trends.
Suppose GBP/USD trades below the 50 EMA on the 4-hour chart. A new peak forms after a weak retracement, followed by a bearish engulfing candle. That signal may provide a lower-risk selling opportunity because it aligns with the dominant trend instead of fighting it.
One lesson many experienced traders learn is not to trade every peak or valley. During ranging markets, price can create several fake-out swing points that quickly fail. Waiting for trend confirmation often improves consistency more than entering every signal.
Best Settings and Practical Adjustments
The default settings work reasonably well on most charts, but adjustments can improve performance depending on trading style.
Scalping
- Timeframe: M5 or M15
- Smaller swing period
- Use alongside a 20 EMA
- Focus on major trading sessions such as London and New York
Intraday Trading
- Timeframe: M30 or H1
- Medium swing sensitivity
- Combine with RSI (14) or MACD confirmation
- Ignore signals during low-volume sessions
Swing Trading
- Timeframe: H4 or Daily
- Larger lookback period
- Confirm trades using higher timeframe trend direction
- Allow wider stop-loss placement based on recent swing levels
Higher sensitivity creates more signals but also more market noise. Lower sensitivity produces fewer signals, though the identified swings tend to carry greater significance.
Advantages, Drawbacks, and Comparison with Similar Indicators
The biggest strength of this indicator is its ability to simplify market structure. Traders can quickly recognize trends without manually marking every swing point.
Other advantages include:
- Easy visual interpretation.
- Helpful support and resistance identification.
- Works across major currency pairs.
- Suitable for trend-following and reversal analysis.
Still, it has limitations.
Since swing confirmation requires future candles, signals aren’t immediate. Fast-moving markets may already travel 20-30 pips before a peak or valley appears. The indicator can also generate several nearby signals during choppy conditions, making trend confirmation essential.
Compared with the ZigZag Indicator, the Peak and Valley Indicator MT4 usually provides a cleaner display while focusing on confirmed swing points rather than continuously redrawing major price moves. Compared with Fractals, it often allows more flexibility through adjustable parameters, giving traders greater control over signal frequency.
Neither tool should become the sole reason for opening a trade. Price action, market context, and sound risk management still carry more weight than any technical indicator.
A practical trading plan might risk only 1% of account equity on each trade while targeting a minimum 1:2 risk-to-reward ratio. That approach helps protect capital even if several trades fail in a row.
How to Trade with Peak and Valley Indicator MT4
Buy Entry

- Buy after a confirmed valley – Enter when a new valley forms and the next candle closes bullish on the EUR/USD 1-hour chart.
- Trade with the trend – Take buy signals only when price stays above the 50 EMA on the 4-hour timeframe.
- Wait for resistance breakout – Buy after price closes 10-15 pips above the last peak with strong momentum.
- Confirm with RSI – Enter when RSI (14) rises above 50 after a valley appears.
- Place a tight stop-loss – Set the stop 15-25 pips below the latest valley to control risk.
- Target a 1:2 reward ratio – Aim for at least 40 pips if risking 20 pips.
- Avoid low-volume sessions – Skip buy entries during quiet Asian trading unless volatility increases.
- Ignore ranging markets – Don’t buy if peaks and valleys are forming inside a narrow 20-30 pip range.
Sell Entry

- Sell after a confirmed peak – Enter when a peak forms and the following candle closes bearish on the GBP/USD 1-hour chart.
- Trade below the 50 EMA – Take sell signals only when price remains below the 50 EMA on the 4-hour chart.
- Wait for support breakdown – Sell after price closes 10-15 pips below the latest valley.
- Confirm with RSI weakness – Enter when RSI (14) falls below 50 after a peak is confirmed.
- Protect with a stop-loss – Place the stop 15-25 pips above the recent peak.
- Secure realistic profits – Target the next support level or maintain a 1:2 risk-to-reward ratio.
- Avoid major news releases – Don’t sell before events like NFP or FOMC, as volatility can invalidate signals.
- Skip strong uptrends – Ignore sell setups on the daily chart if price keeps making higher highs and higher lows.
The Peak and Valley Indicator MT4 gives traders a structured way to read swing highs and swing lows instead of reacting to every market movement. Its main strengths include clearer market structure, better support and resistance identification, and improved trend confirmation. At the same time, traders should remember that confirmed swings appear after price has already moved, and ranging markets can still produce misleading signals. Used alongside moving averages, price action, and disciplined risk management, this indicator becomes a valuable part of a trading plan rather than a standalone decision-maker. Testing it on a demo account across different currency pairs and timeframes is a smart next step before using it in live trading.
Recommended MT4/MT5 Broker
XM Broker
- *FREE $50 To Start Trading Instantly! (Withdraw-able Profit)
- Deposit Bonus up to $5,000
- Unlimited Loyalty Program
- Award Winning Forex Broker
- Additional Exclusive Bonuses Throughout The Year

>> Sign Up for XM Broker Account here <<


