


The Range Filter indicator functions as a volatility-adjusted moving average that adapts to market conditions. Unlike traditional moving averages that lag behind price, this indicator incorporates range-based calculations to filter out insignificant price movements.
Here’s what makes it different: The indicator measures the average true range over a specified period and uses this data to create a dynamic filter. When price movement exceeds the calculated range threshold, the filter acknowledges it as a valid signal. Smaller movements that fall below this threshold get ignored entirely.
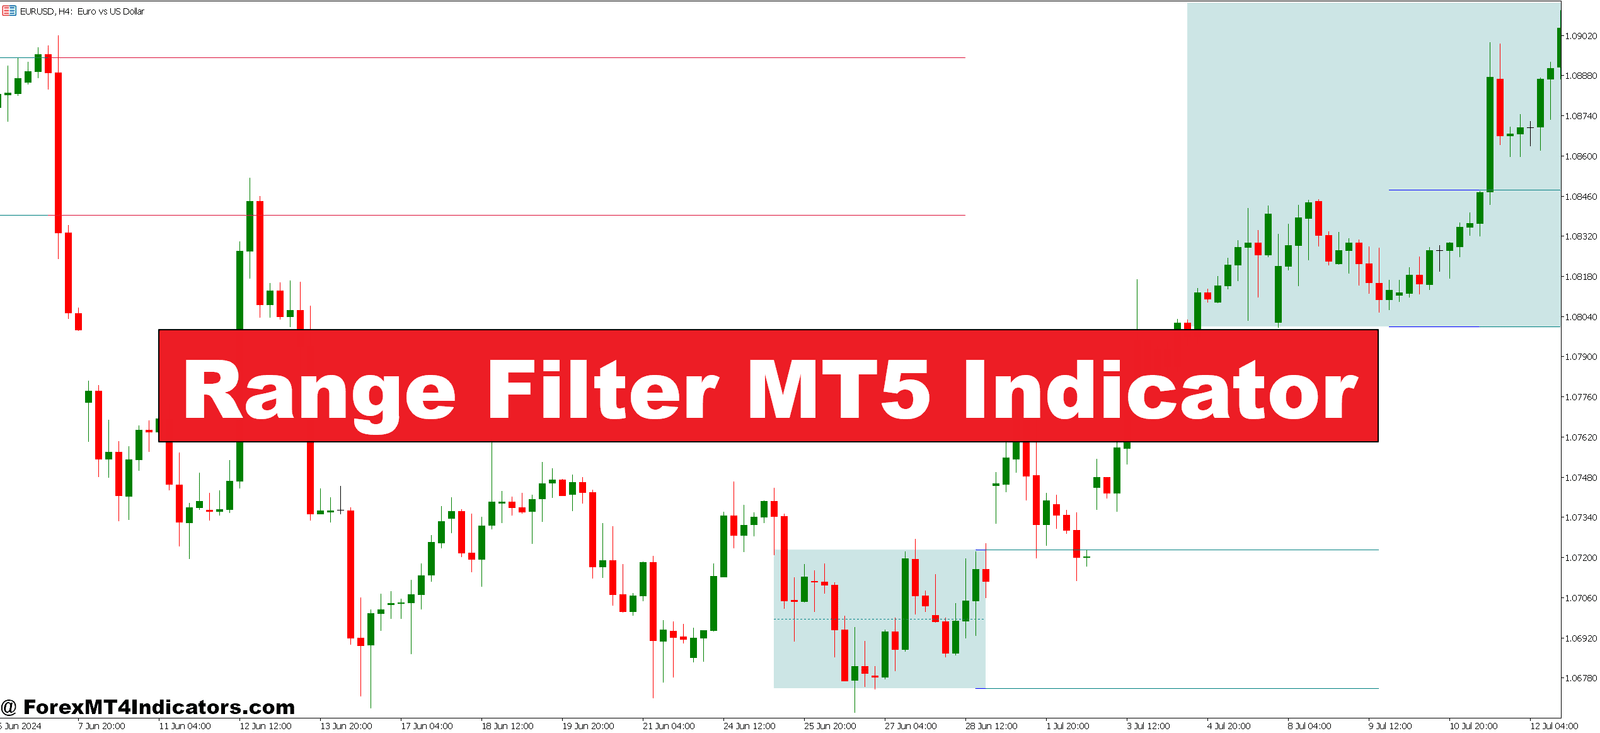
Visually, traders see a colored line that shifts between bullish (typically blue or green) and bearish (usually red or orange) states. The line follows price but doesn’t react to every minor fluctuation. That’s the filtering effect in action.
The Calculation Logic Behind the Scenes
The Range Filter uses a multi-step calculation process. First, it determines the price range by measuring the difference between highs and lows over your specified sampling period. This range value gets smoothed using an exponential moving average to prevent erratic readings.
Next, the indicator calculates upper and lower filter bands around price. These bands expand during volatile periods and contract when markets quiet down. The filter line itself only changes direction when price crosses these adaptive bands with enough momentum to suggest a real move is underway.
Most implementations use the formula: Filter = EMA(Source, Period) ± (Multiplier × Range). The multiplier parameter determines sensitivity—higher values create wider bands that filter more noise but may delay signals. Lower values catch moves earlier but risk more false signals.
Real Trading Applications That Work

On the GBP/JPY 4-hour chart, the Range Filter excels during trending sessions. When the Bank of Japan announced policy changes last March, the pair dropped 400 pips over three days. Traders using the Range Filter with standard settings (period: 100, multiplier: 3.0) would have seen the indicator flip bearish within the first 8 hours and stay red throughout the entire move.
The indicator works best as a directional filter rather than a standalone entry tool. One practical approach: combine it with support and resistance levels. When price breaks a key level AND the Range Filter confirms with a color change, that’s a higher-probability setup. Skip trades where price breaks a level but the filter hasn’t flipped—those often turn into fake-outs.
For scalping, the tool becomes less reliable. On the EUR/USD 5-minute chart, even with aggressive settings, the lag can cost 5-10 pips per entry. But that same lag becomes valuable on the daily timeframe, where it prevents traders from abandoning positions during normal pullbacks.
Day traders might watch the 1-hour chart on USD/CAD during oil inventory reports. The Range Filter helps ignore the initial spike and whipsaw that typically happens in the first 15 minutes post-release. Once the filter stabilizes in one direction, that’s usually when the cleaner, tradable move develops.
Dialing in the Settings

The two main parameters need adjustment based on what you’re trading. The sampling period (often called “length” or “period”) typically defaults to 100. Shorter periods like 50 make the indicator more responsive, which suits volatile pairs like GBP/NZD. Longer periods around 200 work better on stable pairs like EUR/CHF where you want to ignore smaller swings entirely.
The range multiplier usually sits between 2.0 and 4.0. Think of it like a sensitivity control. At 2.0, you’ll catch more moves but deal with more false signals. At 4.0, you’ll wait longer for confirmation but get cleaner trends. There’s no perfect setting—it depends on your risk tolerance and trading style.
Testing different configurations helps. Run the indicator with period 80 and multiplier 2.5 on AUD/USD versus period 150 and multiplier 3.5. You’ll immediately see how the first setup gives more signals while the second filters more aggressively. Some traders even run two instances simultaneously—one fast, one slow—to gauge trend strength.
But here’s the thing: Don’t optimize based on backtests alone. What works on historical data often fails in live markets because you’re curve-fitting to past price action. Choose settings that make logical sense for your timeframe and stick with them long enough to gather meaningful data.
The Honest Truth About Limitations
The Range Filter isn’t a crystal ball. It lags during trend reversals because it needs price to move significantly before changing direction. When USD/JPY reversed from 152 down to 148 last quarter, traders who relied solely on this indicator missed the first 150 pips while waiting for confirmation.
Sideways markets expose another weakness. During consolidation periods—which make up roughly 70% of market conditions—the indicator can flip back and forth multiple times. Those transitions often trigger false entries if you’re using the color change as your only signal. You’ll end up in the same whipsaw situation the indicator was meant to prevent.
The tool also doesn’t account for fundamental events. When the Federal Reserve surprises markets with unexpected hawkish guidance, price can gap right through your filter zones. Technical indicators in general struggle with news-driven volatility because calculations based on historical price can’t predict central bank decisions or geopolitical shocks.
Compared to something like the SuperTrend indicator, the Range Filter provides smoother signals but with more lag. SuperTrend reacts faster to price changes, which means earlier entries but also more fake-outs. The Range Filter takes a more conservative approach. Neither is superior—they serve different trading philosophies.
Against traditional moving averages, this indicator filters noise better but won’t replace the simplicity of a 200-period EMA for identifying major trend direction. Smart traders often use both: the MA for overall bias and the Range Filter for tactical entry timing.
How to Trade with Range Filter MT5 Indicator
Buy Entry

- Filter flips blue above support – Enter long when the Range Filter changes from red to blue within 10-20 pips of a key support level on EUR/USD 4-hour chart; this confirms buyers are defending the zone.
- Double confirmation with RSI – Take the buy signal only when the filter turns bullish AND RSI crosses above 50; skip entries when RSI is already overbought above 70.
- Retest entry after breakout – Wait for price to break resistance, pull back to retest it, then enter when the filter remains blue throughout the pullback on GBP/USD 1-hour charts.
- Stop loss 20 pips below filter line – Place your stop 20-30 pips beneath the blue filter line on majors; if price touches the line and bounces, it validates the trend.
- Avoid during ranging sessions – Don’t take buy signals between 12 AM-3 AM GMT when USD/JPY typically consolidates; wait for London or New York session volume.
- Volume confirmation required – Only enter when the filter flips blue with volume 30%+ above the 20-period average; low-volume signals often fail within 50 pips.
- Risk 1% maximum per trade – Never risk more than 1% of your account on a single Range Filter signal; consecutive false signals during choppy markets can happen 3-4 times in a row.
- Scale out at 2:1 ratio – Close half your position when price moves 60 pips in profit (if risking 30 pips), let the rest run with a trailing stop 40 pips behind the filter line.
Sell Entry

- Filter flips red below resistance – Enter short when the Range Filter turns bearish within 15 pips under a resistance level on EUR/USD daily chart; this signals distribution is complete.
- Momentum divergence setup – Take sell signals when the filter turns red AND price makes a higher high but RSI shows a lower high; these reversals often drop 100+ pips.
- Failed breakout entry – Short when price breaks above resistance but immediately reverses with the filter flipping red; false breakouts on GBP/USD 4-hour charts typically retrace 80% of the spike.
- Stop above recent swing high – Place stops 25-35 pips above the most recent swing high, not just above the filter line; this prevents getting stopped by minor spikes during NFP or central bank announcements.
- Skip sells during strong uptrends – Don’t take red signals when price is above the 200-period EMA on the daily chart; counter-trend trades have 60%+ failure rates even with filter confirmation.
- Wait for candle close confirmation – Never enter mid-candle when the filter just flipped red; wait for the 1-hour or 4-hour candle to fully close to avoid head-fake reversals.
- Reduce size before news events – Cut position size by 50% if entering within 2 hours of FOMC, ECB, or BOE announcements; volatility spikes invalidate technical signals.
- Exit if filter flips back quickly – Close the trade immediately if the filter changes from red back to blue within 3-5 candles; this whipsaw pattern signals choppy conditions and the trend hasn’t established.
Making It Work in Your Trading
The Range Filter MT5 indicator earns its place on charts by providing clarity in choppy conditions and helping traders stay with trends when they develop. It reduces false signals compared to raw price action but won’t eliminate losses or guarantee profits. Trading forex carries substantial risk, and no indicator changes that fundamental reality.
For practical implementation, treat the filter as one component of a complete system. Use it to confirm directional bias from other analysis methods. Respect its limitations during consolidation and major news events. Adjust settings thoughtfully based on the specific pairs and timeframes you trade, then resist the urge to constantly tweak them.
The indicator proves most valuable for traders who struggle with overtrading in rangy markets. If you find yourself taking too many marginal setups and getting chopped up, this filter forces patience by highlighting only the cleaner directional moves. That’s where its real value lies—not in prediction, but in selection.
Recommended MT4/MT5 Broker
XM Broker
- Free $50 To Start Trading Instantly! (Withdraw-able Profit)
- Deposit Bonus up to $5,000
- Unlimited Loyalty Program
- Award Winning Forex Broker
- Additional Exclusive Bonuses Throughout The Year
- Exclusive 90% VIP Cash Rebates for all Trades!


Already an XM client but missing out on cashback? Open New Real Account and Enter this Partner Code: VIP90


