







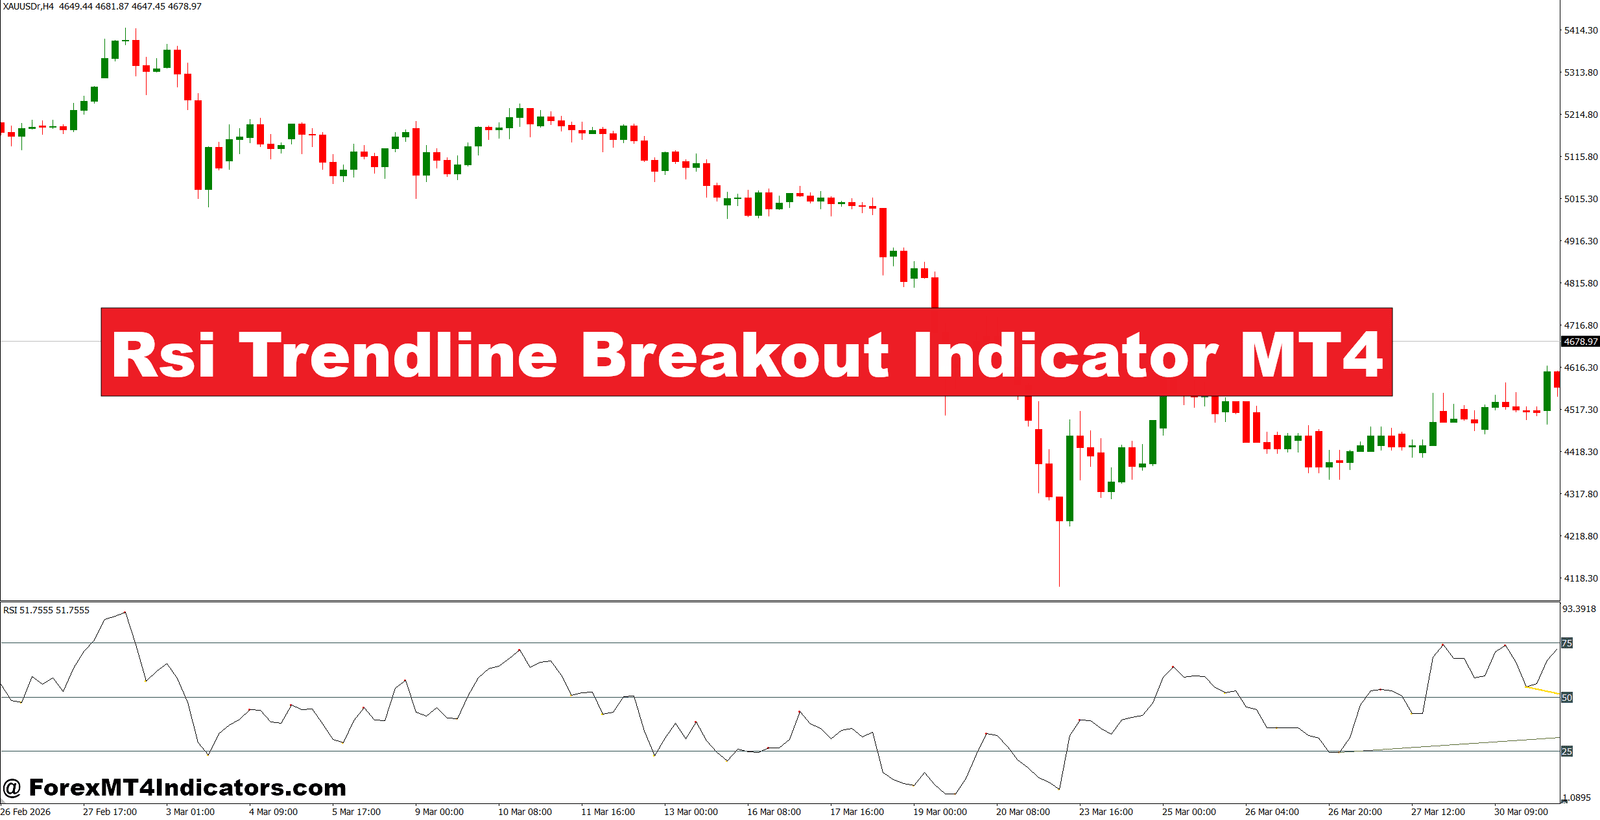
The RSI Trendline Breakout Indicator MT4 aims to make these situations easier to read by combining RSI behavior with trendline breakout logic. Instead of treating an RSI reading above 50 or below 50 as a complete signal, the indicator focuses on breaks in the trend structure formed on the RSI. That can help traders identify momentum changes while keeping price action in the picture.
The key is not to treat every breakout as a trade. Market structure, support and resistance, volatility, and candle confirmation still matter. Here’s how the indicator works and how traders can use it more carefully.
What Is the RSI Trendline Breakout Indicator MT4?
The RSI Trendline Breakout Indicator MT4 is a technical analysis tool designed to identify breaks of trendlines drawn from RSI swing points. It combines the familiar Relative Strength Index with a trendline-based breakout approach.
The standard RSI measures momentum on a scale from 0 to 100. A common setup uses a 14-period calculation:
RSI = 100 − [100 / (1 + RS)]
Here, RS represents average gains divided by average losses over the selected period.
The trendline component adds another layer. Instead of simply looking for RSI above 70 or below 30, the trader watches how RSI forms lower highs, higher lows, and directional swings. A break through one of those lines can suggest that the previous momentum pattern is weakening.
For example, suppose EUR/USD is trading on the 1-hour chart and RSI repeatedly creates lower highs near 58, 54, and 51. A trendline connecting those highs slopes downward. If RSI later closes above that line near 56 while price also breaks a nearby resistance level, the setup becomes more interesting.
The indicator doesn’t predict the next candle. It highlights a potential change in momentum that still needs confirmation.
How the Indicator Generates Breakout Signals
The logic becomes easier to understand when the RSI and price chart are viewed together.
1. RSI swing points form the structure
The indicator first identifies meaningful highs and lows in RSI. Depending on its coding, the exact swing sensitivity can vary. A shorter sensitivity reacts faster but may produce more noise.
For example, RSI readings of 63, 58, 55, and 52 could create a series of declining peaks. Connecting those peaks creates a descending RSI trendline.
2. A breakout challenges the existing momentum
When RSI moves through that trendline, the indicator can mark a bullish or bearish breakout. A bullish break suggests that selling pressure may be losing control. A bearish break suggests weakening buying momentum.
But a breakout inside a tight 10-pip range isn’t automatically useful. Price needs room to move.
3. Price structure provides confirmation
This is where experienced traders can avoid many bad entries.
Suppose GBP/USD produces a bullish RSI trendline break on the 15-minute chart. Price remains below a resistance zone at 1.2760. Buying immediately could expose the trade to a quick rejection.
A stronger setup would occur if price closes above 1.2760, the RSI breakout remains intact, and the next candle holds above the broken level.
A trader might then consider a stop around 8–15 pips below the structure, depending on volatility, rather than placing a random fixed stop.
Practical Trading Setup and Settings

The best settings depend on the pair, timeframe, and trading style. There isn’t one configuration that fits every market.
A useful starting point is a 14-period RSI. On an H1 chart, traders can keep the default period and focus on clear RSI trendlines. On M15, a period around 9–14 can make the indicator more responsive, but the increased sensitivity can also create more false breaks.
For a cleaner approach, traders can use:
- H4: 14-period RSI for larger momentum shifts.
- H1: 14-period RSI for swing and intraday setups.
- M15: 9–14 RSI for faster entries.
- M5: 7–9 RSI only when the trader accepts more market noise.
Consider EUR/USD on H1. Price moves from 1.0820 to 1.0860 while RSI rises from 42 to 61. RSI then pulls back to 50 and forms three declining peaks. When RSI breaks its descending trendline and EUR/USD closes above 1.0850, a trader has two pieces of evidence pointing in the same direction.
The entry could occur around 1.0852–1.0855, with a structural stop near 1.0838. That gives roughly 14–17 pips of initial risk. A first target around 1.0880 would offer approximately 25 pips, giving the trade a risk-to-reward ratio close to 1:1.5.
That doesn’t make the trade guaranteed. If the pair is approaching major H4 resistance, the setup may not have enough room to develop.
When the Market Is Choppy
The indicator deserves extra caution during low-volume sessions and narrow ranges. RSI can break small trendlines repeatedly when price has no clear direction.
When testing similar momentum setups around NFP releases, traders may see RSI jump from 38 to 68 within a few candles. A breakout during that spike can look excellent and then reverse 30 pips in minutes.
For that reason, traders should consider waiting for the first volatility burst to settle rather than entering purely because an RSI trendline has broken.
Strengths, Limitations, and Comparison With Other Indicators
One advantage of the RSI trendline approach is that it gives traders more information than a basic overbought/oversold strategy. RSI can remain above 70 during a strong bullish trend, so selling simply because the indicator reaches 72 can be a poor decision.
The breakout method instead asks whether momentum structure has changed.
It also works well alongside support and resistance. A bullish RSI breakout near established demand is generally more useful than the same signal appearing directly underneath major resistance.
Still, there are limitations. The indicator can lag because RSI itself is calculated from previous price data. Small trendline breaks can also create fake-outs, especially on M1 and M5 charts. Different versions of the indicator may use different swing calculations, so traders should check the actual settings and signal behavior before relying on it.
Compared with a standard 14-period RSI, the trendline version adds structural information. Compared with a moving-average crossover, it focuses more directly on momentum swings rather than price crossing an average. Compared with MACD, it can provide a more compact view of RSI structure, but MACD may be better suited to traders who want trend and momentum information from price-derived averages.
No single tool wins every market condition.
A sensible workflow is to use the RSI Trendline Breakout Indicator MT4 for the alert, price action for confirmation, and support or resistance for trade location. If those three disagree, skipping the setup is often better than forcing a trade.
A Simple Trading Framework
A practical setup can follow five steps.
- Start with the higher timeframe – Check H4 or H1 structure first. If price is making higher highs and higher lows, bullish RSI breakouts generally deserve more attention than countertrend sells.
- Mark nearby levels – Identify support and resistance before looking for an entry. A breakout signal with 10 pips of resistance directly ahead has limited appeal.
- Wait for the RSI trendline break – Let RSI close beyond the established trendline rather than reacting to an intrabar spike.
- Confirm with price – Look for a breakout candle, rejection pattern, higher low, or break of a minor market-structure level.
- Control the risk – Many intraday traders may risk around 0.5%–1% of account equity on one setup. Stop placement should follow market structure and volatility rather than an arbitrary number.
For example, on GBP/USD M15, a trader might see RSI break upward after forming higher lows while price breaks a 1.2700 resistance level. If the entry occurs near 1.2705 and the structural stop is 12 pips away, a 1:2 target would sit around 1.2729. If price stalls and forms a strong rejection before reaching that level, the trader can reduce exposure rather than waiting blindly for the target.
The indicator works best as part of a process, not as an automatic buy-and-sell machine.
Trading forex carries substantial risk. No indicator guarantees profits. Traders should test the indicator on historical data and a demo account before committing real money, especially when changing its RSI period or using it on very low timeframes.
How to Trade with Rsi Trendline Breakout Indicator MT4
Buy Entry

- Wait for a bullish RSI breakout – Enter after RSI breaks above its descending trendline and closes above it on the 1-hour chart.
- Confirm above 50 RSI – Prefer BUY signals when RSI moves above 50, showing stronger bullish momentum.
- Check resistance breakout – On EUR/USD H1, look for price to break resistance by at least 5–10 pips before entering.
- Use H4 trend direction – Favor BUY trades when the 4-hour chart shows higher highs and higher lows.
- Set a 10–20 pip stop – Place the stop below the recent swing low or support, depending on pair volatility.
- Target 20–40 pips – Aim for at least a 1:2 risk-to-reward ratio when trading EUR/USD or GBP/USD.
- Risk only 0.5–1% – Keep account risk small, especially when trading breakout signals during volatile sessions.
- Skip weak breakouts – Don’t BUY if RSI breaks the trendline but price remains below resistance or quickly falls back within 5–10 pips.
Sell Entry

- Wait for a bearish RSI breakout – Enter after RSI breaks below its rising trendline and closes beneath it on the 1-hour chart.
- Confirm below 50 RSI – Prefer SELL setups when RSI falls below 50, confirming weakening bullish momentum.
- Watch support breaks – On GBP/USD H1, look for price to close at least 5–10 pips below established support.
- Follow H4 bearish structure – Give SELL signals more weight when the 4-hour chart forms lower highs and lower lows.
- Place a 10–20 pip stop – Position the stop above the recent swing high or nearby resistance.
- Aim for 20–40 pips – Look for a minimum 1:2 risk-to-reward setup before entering the trade.
- Limit risk to 0.5–1% – Reduce position size when volatility expands or the signal appears against the daily trend.
- Avoid late SELL signals – Don’t enter if EUR/USD or GBP/USD has already dropped 30–40 pips before the RSI breakout confirms.
Final Takeaways
The RSI Trendline Breakout Indicator MT4 can help traders recognize changes in momentum that a basic RSI reading may overlook.
- It uses RSI swing structure rather than relying only on 70/30 levels.
- Price action and market structure can improve breakout confirmation.
- H1 and H4 charts generally provide cleaner signals than very low timeframes.
- Risk management remains essential because false breakouts and whipsaws will occur.
The most useful approach is to treat the indicator as a confirmation tool. A trader who waits for a meaningful RSI break, checks the surrounding price structure, and calculates risk before entering will usually have a stronger process than someone who follows every arrow or alert. Before using the RSI Trendline Breakout Indicator MT4 with real funds, testing it across different pairs and market conditions can reveal where its signals are genuinely useful—and where they should simply be ignored.
Level up your trading
Learn to read the chart — not just the indicator
eBook · Instant PDF
The Candlestick Playbook
Read and trade 40+ candlestick patterns — with exact entries, stops and exits.
Video Course · 12 modules
The Price Action Masterclass
Read clean charts the no-indicator way — pin bars, support & resistance, entries and exits.
Recommended MT4/MT5 Brokers
XM
- ✓ *FREE *$50 to start (withdrawable)
- ✓ Deposit bonus up to $5,000
- ✓ Negative balance protection
Trading forex and CFDs carries a significant risk of loss and is not suitable for everyone. Broker links are affiliate links — we may earn a commission at no cost to you.
Free MT4 Indicator Download


