


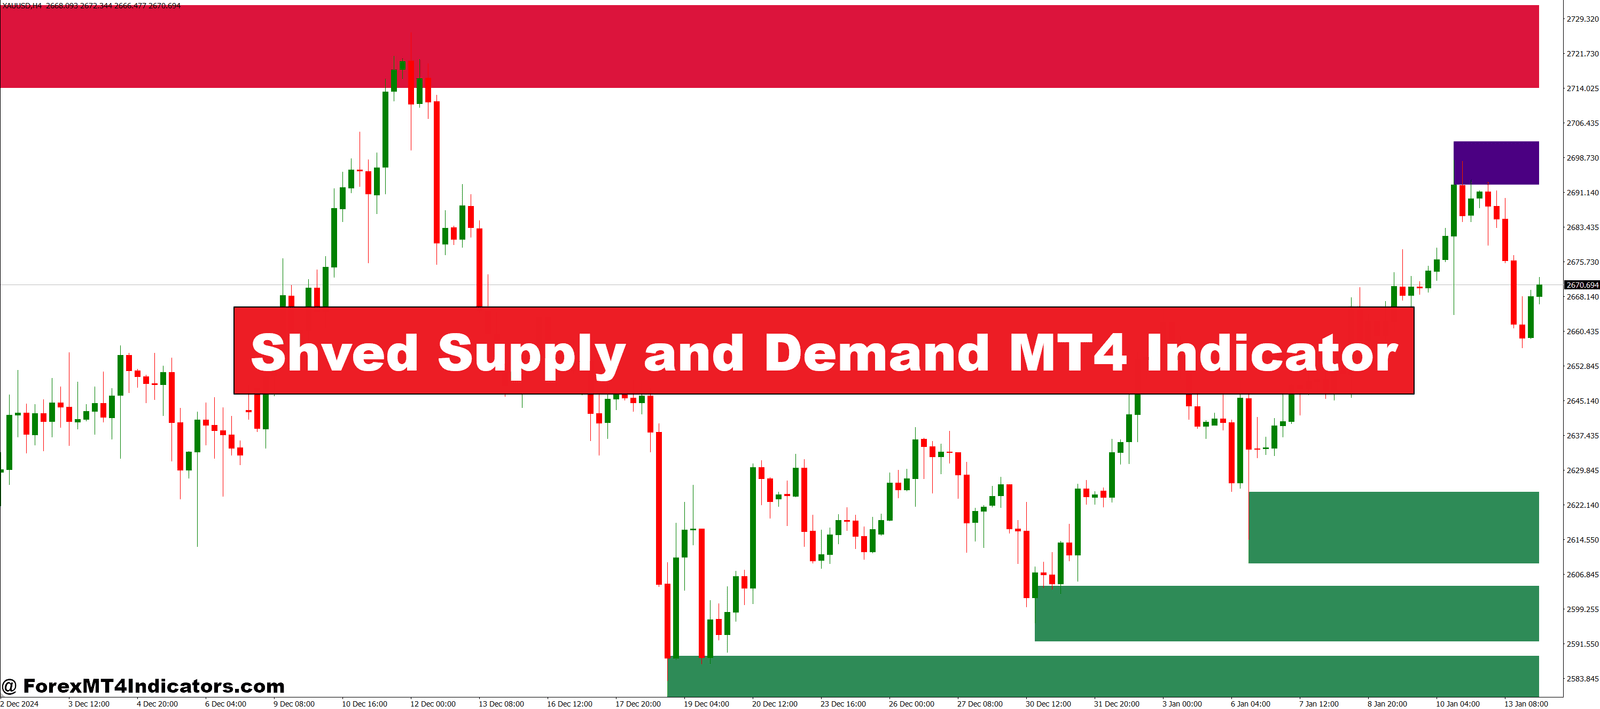

The Shved Supply and Demand indicator is a smart tool that highlights important price zones where buying or selling pressure is strongest. It automatically detects and draws these levels based on recent price action, making it easier for traders to understand where the market may turn. Supply zones act like resistance where sellers may take control, while demand zones act as support where buyers could step in. This visual map of market strength can help traders stay ahead of potential reversals.
How It Helps Traders Make Better Decisions
Instead of guessing where to enter or exit a trade, traders can use the zones identified by the indicator to plan more accurate entries and exits. For example, if price approaches a demand zone, traders might look for a buying opportunity. If it moves into a supply zone, it could be a signal to sell or take profit. This method supports smart risk management because traders can place stop-loss orders just outside the zones, limiting potential losses while aiming for higher rewards.
Easy to Use with Any Strategy
One of the best parts of the Shved Supply and Demand indicator is its flexibility. It works well with any trading strategy, whether you’re using moving averages, trendlines, or candlestick patterns. Beginners appreciate how it simplifies the chart, while advanced traders use it to fine-tune their strategies. It doesn’t flood your screen with signals—it just highlights what matters: where price is likely to react.
Perfect for Both Short-Term and Long-Term Trading

Whether you’re day trading or holding positions for longer periods, this indicator adapts to different timeframes. On smaller charts like M15 or H1, it can help identify quick trades, while on H4 or Daily charts, it shows broader zones for swing trading. This makes it a useful tool across different trading styles and market conditions.
How to Trade with Shved Supply and Demand MT4 Indicator
Buy Entry

- Wait for the price to approach or touch a demand zone (marked in blue or green).
- Look for bullish candlestick patterns (like pin bars, engulfing candles) forming inside or near the demand zone.
- Confirm that the market is not in a strong downtrend using another tool like a moving average or trendline.
- Enter a buy trade once bullish confirmation is clear and the price starts to bounce.
- Place your stop-loss just below the demand zone.
- Set your take-profit near the next supply zone or based on a risk-reward ratio like 1:2.
Sell Entry

- Wait for the price to approach or touch a supply zone (marked in red or orange).
- Look for bearish candlestick patterns (like shooting star, bearish engulfing) near the supply zone.
- Make sure the market isn’t in a strong uptrend use other tools for confirmation if needed.
- Enter a sell trade once the price shows signs of rejection at the supply zone.
- Place your stop-loss just above the supply zone.
- Set your take-profit near the next demand zone or based on a solid risk-reward plan.
Conclusion
The Shved Supply and Demand MT4 Indicator offers a clear, simple, and effective way to understand price behavior. By showing key areas where buyers and sellers are likely to act, it gives traders a better edge in the market. If you’re tired of second-guessing your trades, this tool could be the missing piece you’ve been looking for. Give it a try and bring more structure and clarity to your trading decisions.
Recommended MT4/MT5 Broker
XM Broker
- Free $50 To Start Trading Instantly! (Withdraw-able Profit)
- Deposit Bonus up to $5,000
- Unlimited Loyalty Program
- Award Winning Forex Broker
- Additional Exclusive Bonuses Throughout The Year
- Exclusive 90% VIP Cash Rebates for all Trades!

Already an XM client but missing out on cashback? Open New Real Account and Enter this Partner Code: VIP90


