


If you trade XAG/USD, silver CFDs, silver futures, or silver ETFs, here’s a deeper dive into what moved silver this week and what to watch going into next week.
Silver spent the week in a tug of war between a hawkish Fed and support that refused to give.
It closed the week at $75.55. Down half a percent from where it started.
The Week in Review
Here’s how silver traded through the week.
Monday
Diplomatic optimism around US-Iran talks built early in the week, with reports of a new US push for negotiations in Pakistan.
Optimism around a deal → lower oil expectations → less inflation pressure → less pressure on silver.
Silver opened near $75.96, holding the support zone from the previous week.
Tuesday
Quiet session. Markets held position ahead of Wednesday’s FOMC minutes release. No fresh catalysts moved silver.
Wednesday
The Federal Reserve released the minutes from its April 28-29 meeting at 2:00 PM ET. A majority of officials signaled readiness to hike rates if inflation stays elevated. Four dissents, the most internal disagreement since 1992.
The dollar surged and the 10-year Treasury yield moved back toward 4.6%. CME FedWatch shows December rate hike probability at 67.9%.
Open to hiking → stronger dollar → higher yields → higher cost of holding non-yielding assets → silver should drop.
Silver barely moved on the day. Higher rates are kryptonite for silver. Silver pays no yield. When the cost of holding cash rises, silver loses.
Thursday
Silver closed higher.
Rubio said there were “good signs” a deal was in sight but warned any agreement would be unfeasible if Iran pursued a toll system over Hormuz transit. “No one in the world is in favor of a tolling system,” he said.
Friday
Kevin Warsh was sworn in as Federal Reserve chair at the White House.
His first policy meeting is June 16-17. Markets have limited visibility into his inflation priorities, which means that meeting the next scheduled moment that changes the rate picture.
Reports emerged that Iran and Oman were developing a toll framework to formalize Iranian control over Hormuz transit. Trump rejected the proposal. Talks remain deadlocked on enriched uranium and Hormuz control.
Oil bounced. Silver fell 1.69% to an intraday low of $75.35 before recovering to close at $75.55.
Expensive oil → persistent inflation → hike narrative revived → silver drops.
That chain has run since the war began. It ran again on Friday.
The weekly picture on oil is actually more constructive. Brent crude fell more than 5% on the week to close near $103.54 as diplomatic language around US-Iran talks turned marginally positive. Progress, not resolution.
Technical Backdrop
Here’s what the chart shows now.
Recent Price Action
Silver opened the week near $75.96 and went essentially nowhere.
The week’s range was tight, with Thursday’s intraday high the strongest point of the week before Friday pulled price back to close at $75.55.
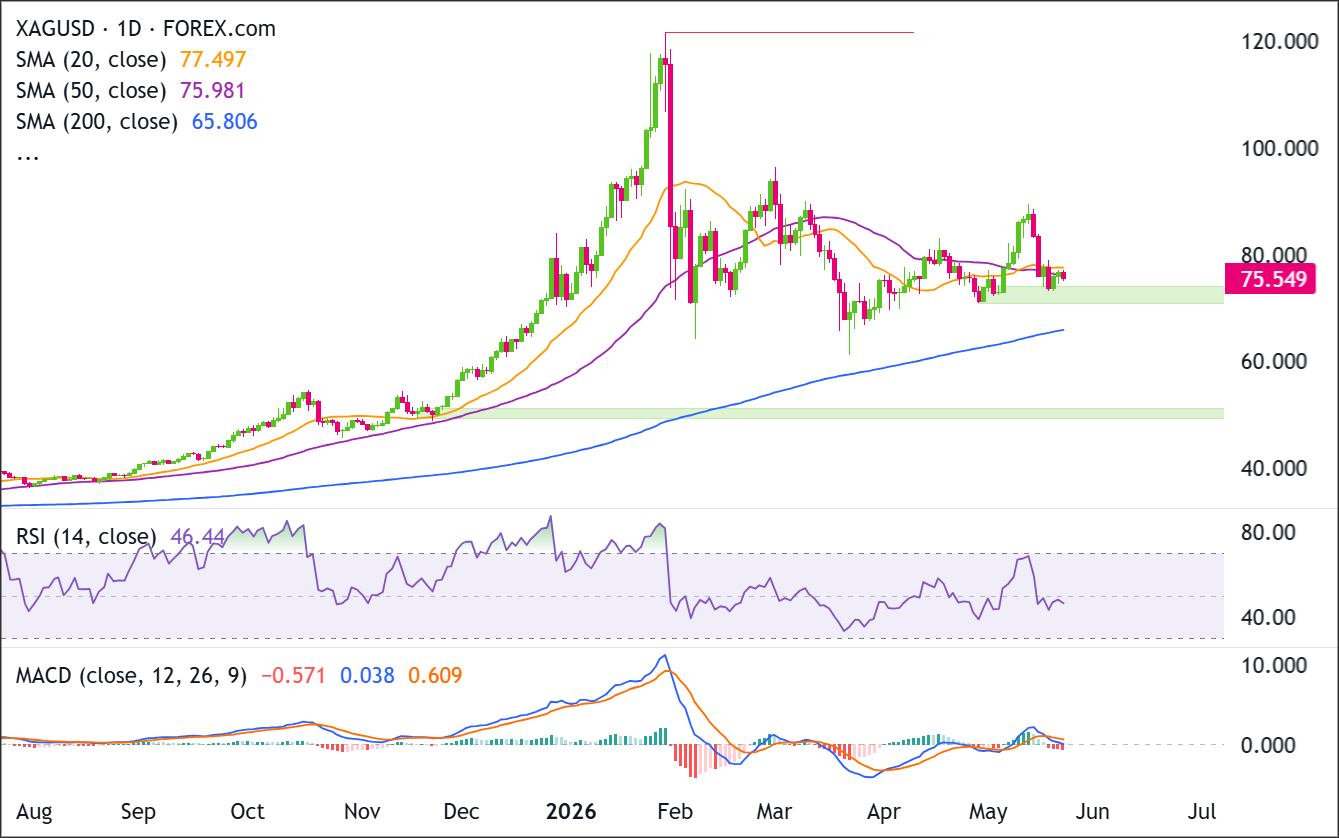
The weekly candle is tight and indecisive, sitting right at the 50 SMA.
Two weeks in a row of the same story: price testing the underside of that level, unable to push through it cleanly in either direction.
Moving Averages
The 200 SMA sits at $65.81. Still far away. The structural bull floor was never in danger this week.
The 50 SMA at $75.98 is the level that matters. Silver closed at $75.55 Friday. That puts price below the 50 SMA for the second straight week. Clinging to the underside without breaking cleanly or reclaiming it.
The 20 SMA at $77.50 sits above both the 50 SMA and price. Two short-term averages stacked overhead. That’s not a bullish picture.
Momentum
RSI is at 46. Below neutral and drifting lower, with room to fall before it signals a flush.
MACD printed a bearish crossover this week: the MACD line crossed below the signal line. And the histogram turned negative. Momentum is pointing down, not sideways.
Key Support & Resistance Levels
Here are the levels worth having on your screen heading into next week.
| Level Type | Price Zone | Technical Significance |
|---|---|---|
| Major Resistance | $87 to $90 | Last week’s spike high zone; pre-ATH consolidation area |
| Secondary Resistance | $80 to $82 | Prior failed recovery ceiling |
| Immediate Resistance | $75.98 to $77.50 | 50 SMA and 20 SMA stacked directly above price |
| Immediate Support | $75 to $75.35 | This week’s low; consolidation support zone holding for two weeks |
| Major Support | $72 to $74 | Prior war selloff lows |
| Structural Floor | $65.81 | 200 SMA; the long-term bull market floor |
Current Market Conditions at a Glance
Everything in one place.
| Indicator | Reading | What It’s Telling You |
|---|---|---|
| XAG/USD Close | ~$75.55 | Down ~0.5% on the week. Held the $75 support despite minutes showing the Fed open to hiking if inflation persists. |
| Distance from ATH ($121.67) | ~37.9% below | Still deep in correction territory. January’s blow-off top did lasting damage. |
| 200 SMA | $65.81 | Price is well above it. The structural bull trend was never threatened. |
| 50 SMA | $75.98 | Price closed below it for the second straight week. Not a clean breakdown, but not a hold either. |
| RSI (14-day) | 46 | Below neutral and drifting lower. Room to fall before it signals a real flush. |
| MACD | Bearish crossover | MACD line (-0.571) crossed below the signal (0.038). Momentum pointing down. |
| Gold/Silver Ratio | ~60 | Compressed to 59.2 intraday Thursday, recovered by Friday. Flat on the week. |
| Managed Money Positioning | Net long 24,671 contracts (May 19) | Specs trimmed ~1,440 contracts on the week. Not crowded, but reducing. Less flush risk, no buying catalyst yet. |
| Brent Crude | ~$103/bbl | Down ~5% on the week. Diplomatic optimism on US-Iran talks moved oil lower. Still elevated. |
| Fed Rate Expectations | 0% cut probability; ~68% hike by December | CME FedWatch shows 67.9% probability of at least one hike by December. Cut probability is zero. |
| Next Key Event | April PCE (May 28) | Hot print revives the hike narrative. Cool print gives silver a path back above the 50 SMA. |
The Big Thing to Watch Next Week
April PCE lands Wednesday, May 28. This is the Fed’s preferred inflation gauge, the number policymakers actually watch when deciding rate policy (although this may change under Warsh).
A hot reading pushes December hike odds higher and puts the $75 support in real danger. That zone breaks and the $72 to $74 war selloff lows are next.
A cool reading gives the hike narrative its first doubt in weeks and creates a path back above the 50 SMA toward $78 to $80.
Key Levels to Watch Next Week
If you’re looking to go long, wait for a close above the 50 SMA at $75.98 and confirmation it holds. Two weeks of rejection at that level means buying below it is fighting the trend. A reclaim changes that. A cool PCE print is one scenario that could trigger it.
If you’re already long, watch how price behaves at the 50 SMA. A clean hold above it improves the setup. A rejection there is a reason to reduce, as it would confirm the level as overhead resistance rather than temporary noise. A hot PCE print is the clearest risk to the downside.
If you’re looking to go short, a break below $75 that holds is the setup. The $72 to $74 war selloff lows are the next level of significance below.
Two weeks of support holding there is a warning. Wait for the break, not just the test. A hot PCE print is one scenario that could provide it.
If you’re already short, the $75 support zone is the level to watch. Two weeks of holding it is a warning. A close back above the 50 SMA at $75.98 is a reason to cover. A cool PCE print increases that risk.
Bottom Line
Silver basically ended the week where it started.
The $75 support zone held even as the minutes pushed December hike odds to 67.9%, oil bounced, and Friday sold off.
But price is still stuck below the 50 SMA at $75.98 and the 20 SMA at $77.50. MACD crossed bearish. RSI drifted lower.
Nothing about the technical picture improved this week.
Silver isn’t breaking down. It’s also not breaking out.


