







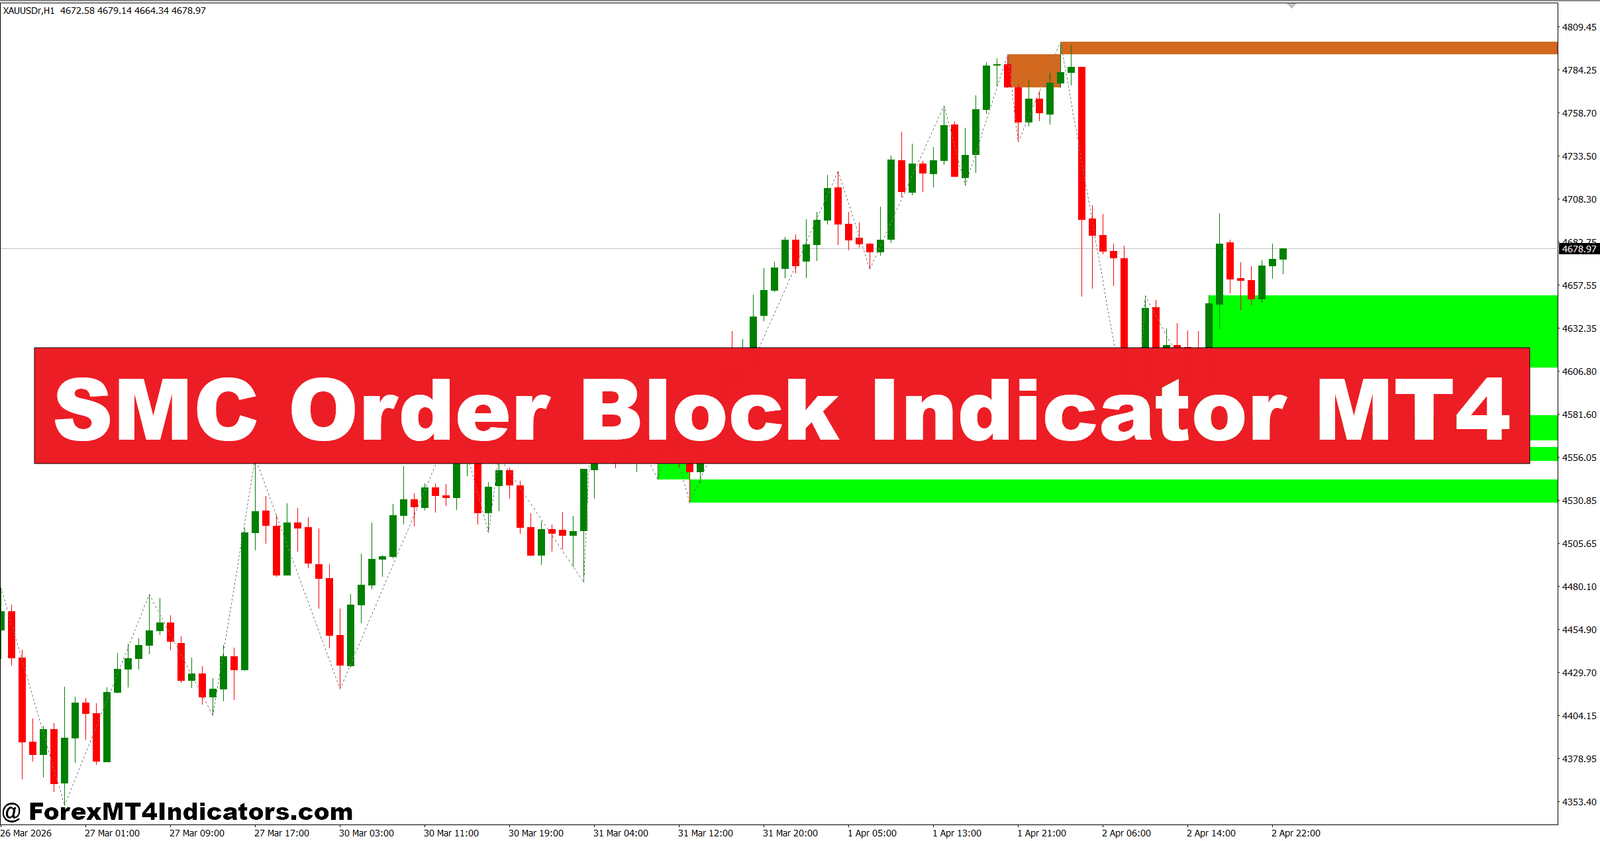
The SMC Order Block Indicator MT4 was designed to help traders avoid many of these situations by highlighting areas where institutional buying or selling may have entered the market.
Poor entries often lead to unnecessary losses, emotional decisions, and larger drawdowns. Many retail traders chase candles instead of waiting for price to return to important market structure levels. Over time, this habit can reduce consistency, even when the overall market direction is correct.
The SMC Order Block Indicator MT4 gives traders a structured way to identify potential demand and supply zones based on Smart Money Concepts (SMC). Instead of guessing where large market participants may step in, the indicator marks these areas directly on the chart. That gives traders a clearer plan before placing an order. The following sections explain how it works, where it performs best, and what traders should watch before relying on its signals.
Understanding the SMC Order Block Indicator MT4
The SMC Order Block Indicator MT4 is a price action tool built around the idea that banks and large institutions often leave footprints before strong market moves. These footprints appear as order blocks, which are the last bullish candle before a bearish move or the last bearish candle before a bullish move.
The indicator scans historical price movement and identifies these zones automatically. Instead of drawing rectangles manually, traders receive visual areas where price may react in the future.
Unlike traditional support and resistance indicators, order blocks focus on the origin of significant momentum. This approach attempts to identify where institutional orders may still be resting.
Many traders combine these zones with market structure shifts, liquidity sweeps, and break of structure (BOS) signals to improve trade quality.
How the Indicator Identifies Order Blocks
The indicator follows price structure rather than mathematical oscillators. It searches for strong impulsive moves that break previous highs or lows. The final candle before that impulse becomes the potential order block.
For example, suppose EUR/USD on the 1-hour chart trades around 1.1240. Price forms a bearish candle before rallying more than 90 pips and breaking the previous swing high. The indicator marks that bearish candle as a bullish order block. Days later, price pulls back into the zone, slows down, and buyers enter again.
That doesn’t mean every revisit will create another rally. Some order blocks fail, especially during major economic releases or trend reversals.
When testing this during volatile NFP days, many traders notice that fresh order blocks created after the news tend to perform better than older zones formed several sessions earlier. Fresh institutional activity often carries more weight than levels that have already been tested multiple times.
Price rejection inside the zone becomes even stronger when combined with:
- Market structure break
- Liquidity grab above recent highs or lows
- Strong bullish or bearish engulfing candle
- Increased trading volume, when available
Applying the Indicator in Real Trading

The indicator works best when traders allow price to come to them instead of chasing momentum.
Imagine GBP/USD trending higher on the 4-hour chart. Price creates a new higher high before retracing nearly 70 pips into a marked bullish order block. Rather than buying immediately, a trader waits for a bullish rejection candle and enters after the next candle closes.
The stop loss sits about 15-25 pips below the order block, depending on market volatility. The first profit target may be the previous swing high, while a second target could follow a risk-to-reward ratio of 1:2 or 1:3.
On USD/JPY, the same concept works in reverse. Price reaches a bearish order block after a strong rally. Once sellers reject the zone with a bearish engulfing pattern, the trader enters a short position while placing the stop above the order block.
Here’s the thing. Waiting for confirmation often reduces losing trades compared with entering as soon as price touches the zone.
Trading forex carries substantial risk. No indicator guarantees profits. Strong risk management remains more important than finding the perfect entry.
Best Settings and Practical Customization
Most versions of the SMC Order Block Indicator MT4 require very little adjustment, but traders can still improve performance by matching settings with their preferred trading style.
Scalpers trading the 5-minute or 15-minute chart often reduce the minimum impulse size so smaller institutional moves remain visible. This works well on liquid pairs like EUR/USD and GBP/USD during the London session.
Swing traders usually prefer the 4-hour and Daily charts because higher-timeframe order blocks tend to produce stronger reactions. They also filter out much of the market noise seen on lower charts.
Many experienced traders use this workflow:
Higher-Timeframe Analysis
Identify the overall trend on the Daily or 4-hour chart before looking for entries.
Entry Confirmation
Drop to the 1-hour or 15-minute chart and wait for price action confirmation inside the order block.
Risk Management
Risk only 1% to 2% of account equity on each trade. Even high-quality setups experience losing streaks.
Avoid trading every marked order block. Zones formed during sideways markets or heavy chop generally have lower probability than those created after decisive trend movements.
Strengths, Weaknesses, and Comparison with Similar Tools
The biggest advantage of the SMC Order Block Indicator MT4 is speed. It removes much of the manual drawing process and helps traders identify institutional zones within seconds.
Another benefit is consistency. Every chart follows the same detection logic, making backtesting easier.
Still, the indicator has limitations.
Order blocks are based on historical price movement. They cannot predict unexpected central bank announcements, geopolitical events, or sudden shifts in market sentiment. Older order blocks also lose reliability after multiple retests.
Compared with a standard Supply and Demand Indicator, order blocks focus more on the candle that initiated the move rather than the entire imbalance area. Traders using Smart Money Concepts often prefer this narrower approach because it provides tighter stop-loss placement.
Against moving averages, the difference is even clearer. Moving averages react after price changes, while order blocks highlight potential reversal zones before confirmation appears. Many traders combine both tools, using a 200 EMA to confirm trend direction while entering from fresh order blocks.
The indicator performs best as one part of a complete trading plan instead of acting as a standalone signal generator.
How to Trade with SMC Order Block Indicator MT4
Buy Entry

- Wait for price to revisit a bullish order block – Buy when EUR/USD returns to a fresh bullish zone on the 1-hour chart.
- Confirm with a bullish candle – Enter after a bullish engulfing or pin bar closes inside the order block.
- Trade with the higher-timeframe trend – Take buy trades only if the 4-hour trend remains bullish.
- Place a tight stop-loss – Keep the stop 10-20 pips below the order block to control risk.
- Target at least 1:2 risk-to-reward – Risk 20 pips to aim for a 40-pip or larger profit.
- Risk only 1%-2% per trade – Protect trading capital during losing streaks.
- Use London or New York sessions – Buy when market liquidity is high for better price movement.
- Avoid high-impact news – Skip buy entries 15-30 minutes before major events like NFP or FOMC.
Sell Entry

- Wait for price to revisit a bearish order block – Sell when GBP/USD retests a fresh bearish zone on the 1-hour chart.
- Confirm with a bearish candle – Enter after a bearish engulfing or rejection candle forms.
- Follow the higher-timeframe downtrend – Take sell trades only when the 4-hour chart shows lower highs.
- Place the stop-loss above the zone – Keep it 10-20 pips above the bearish order block.
- Aim for a 1:2 or 1:3 reward – Risk 25 pips to target 50-75 pips.
- Limit account risk to 1%-2% – Consistent position sizing helps reduce drawdowns.
- Watch for liquidity sweeps – Sell after price briefly breaks the order block and quickly rejects it.
- Avoid ranging markets – Don’t sell when the Daily chart shows sideways price action without a clear trend.
The SMC Order Block Indicator MT4 offers traders a practical way to spot areas where institutional activity may influence future price movement. It simplifies chart analysis by automatically identifying potential buying and selling zones, works well alongside market structure and trend confirmation, and encourages patience instead of impulsive entries. At the same time, traders should remember that no technical tool predicts every market move. Combining this indicator with disciplined risk management, confirmation candles, and higher-timeframe analysis often produces more reliable results than using it alone. Traders willing to test the indicator carefully through historical charts and demo trading will gain a better understanding of where it fits into their own trading strategy.
Recommended MT4/MT5 Broker
XM Broker
- *FREE $50 To Start Trading Instantly! (Withdraw-able Profit)
- Deposit Bonus up to $5,000
- Unlimited Loyalty Program
- Award Winning Forex Broker
- Additional Exclusive Bonuses Throughout The Year


>> Sign Up for XM Broker Account here <<
(Free MT4 Indicators Download)




