


A snippet on oil from Société Générale, looking at Brent:
- A falling wedge generally denotes receding downward momentum; this is also highlighted by daily MACD which held on to last July’s lows and has entered positive territory.
- However, reclaiming the upper limit of the wedge at $89/90 is essential to affirm an extended up-move towards $94 and graphical levels of $98/100.
- If Brent is unable to defend the 50DMA near $84, the down move is likely to resume. Next potential supports could be at low of December at $75.10 and projections of $73/72.
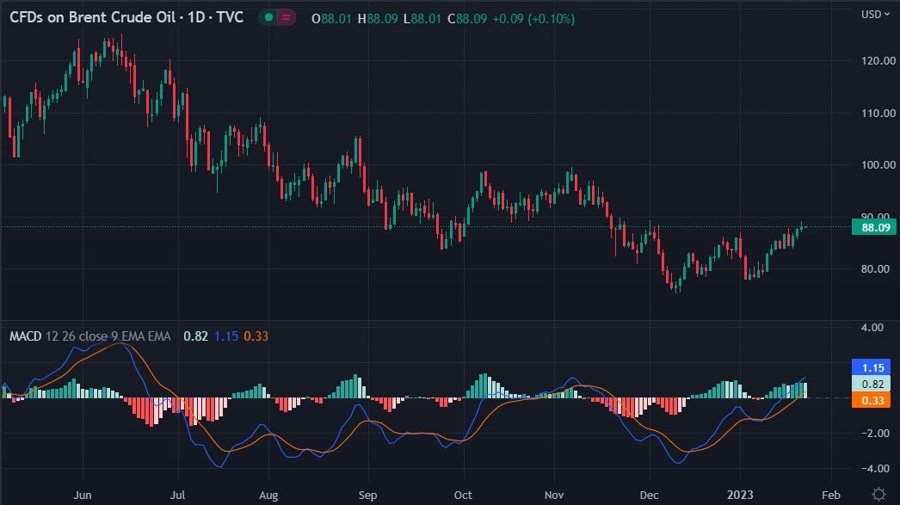
The below is my chart, trying to duplicate what SG is referring to. I’ve added the MACD
MACD
Moving Average Convergence/Divergence (MACD) is a technical analysis indicator used for trading financial instruments, such as stocks, commodities, and foreign exchange.Created by Gerald Appel in the 1970’s, its purpose is to provide information to the trader with regards to an instrument’s current movement and potential behavior. Traders typically use the MACD to assist them in making decisions on whether to buy or sell a given asset.At the heart of it, the MACD indicator is essentially a coupl
Moving Average Convergence/Divergence (MACD) is a technical analysis indicator used for trading financial instruments, such as stocks, commodities, and foreign exchange.Created by Gerald Appel in the 1970’s, its purpose is to provide information to the trader with regards to an instrument’s current movement and potential behavior. Traders typically use the MACD to assist them in making decisions on whether to buy or sell a given asset.At the heart of it, the MACD indicator is essentially a coupl
Read this Term , using default settings. I am not sure of the falling wedge that SG is referring to though.
I may be wrong and, of course, let me know in the comments your thoughts! The chart is from our site and is available here. The code is ‘UKOIL’.


