







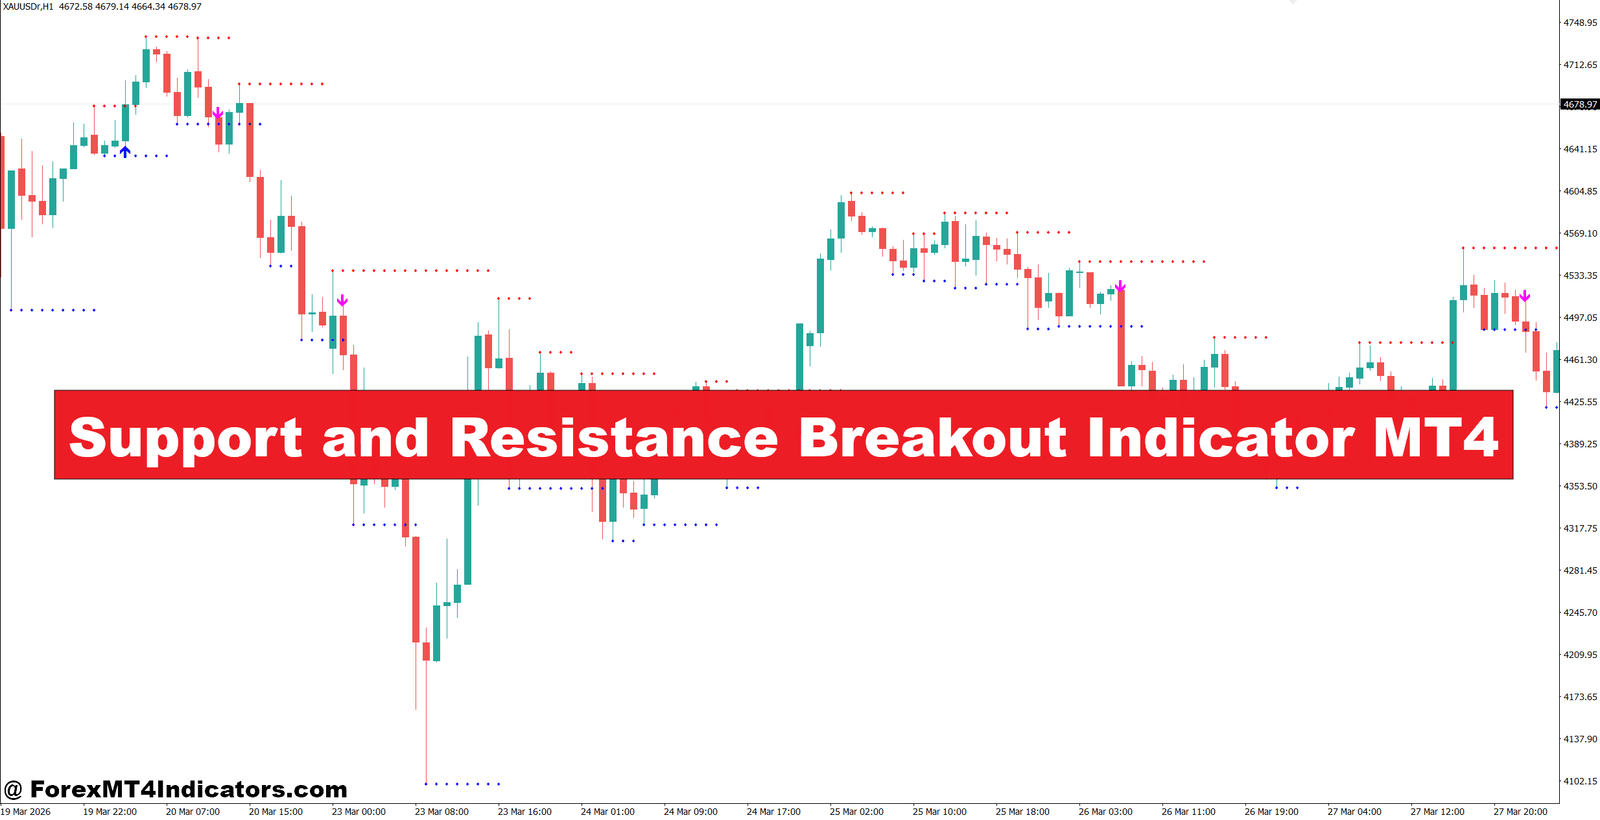
The Support and Resistance Breakout Indicator MT4 helps traders recognize when price is attempting a genuine breakout instead of another failed test. Missing these moves can mean giving up dozens of pips, while chasing false breakouts often leads to unnecessary losses and frustration. After several losing trades, many traders begin doubting their strategy rather than their entry timing.
This indicator focuses on identifying important price levels and highlighting potential breakout opportunities as they develop. Instead of guessing where the market might move next, traders receive a clearer picture of where buying or selling pressure is increasing. The sections below explain how the indicator works, where it performs best, and how traders can use it in real market conditions.
Understanding the Support and Resistance Breakout Indicator MT4
Support and Resistance Breakout Indicator MT4 is a technical analysis tool designed to locate important price zones where buyers and sellers have repeatedly entered the market. Once those levels are established, the indicator monitors price action for confirmed breakouts above resistance or below support.
Unlike a simple horizontal line drawn manually, the indicator updates as market structure changes. Some versions also include breakout arrows, colored zones, or alert notifications whenever price closes beyond a significant level.
The underlying logic is straightforward. Resistance forms where selling pressure has repeatedly stopped upward movement, while support develops where buying pressure prevents further declines. When enough orders push through either level, momentum often increases as stop-loss orders and breakout traders enter the market.
Many traders combine this indicator with candlestick confirmation rather than trading every breakout immediately. That simple filter removes many weak signals.
How the Indicator Detects Breakouts
Most versions calculate support and resistance using previous swing highs and swing lows over a selected lookback period. Others incorporate fractals, pivot points, or historical closing prices to improve accuracy.
When price approaches one of these zones, the indicator watches several conditions before generating a signal. Common factors include:
Price Closing Beyond the Level
A candle that closes outside resistance carries more weight than one that simply spikes above it. The same rule applies when price breaks below support.
Market Momentum
Some versions add moving averages or Average True Range (ATR) filters to avoid signals during low-volatility periods.
Retest Confirmation
Experienced traders often wait for price to revisit the broken level before entering. A successful retest usually provides a lower-risk entry with a tighter stop loss.
For example, EUR/USD on the 1-hour chart spent nearly twelve hours trading below 1.1080 resistance. After a strong bullish candle closed above that level, price pulled back by around 12 pips before buyers stepped in again. The continuation produced nearly 65 pips during the next trading session.
That type of setup generally offers better probability than entering on the first breakout candle.
Practical Trading Applications
Breakout trading works best when combined with market context rather than relying on one indicator alone.
A trader analyzing GBP/USD on the 4-hour chart may notice resistance around 1.2850. The indicator identifies the level several hours before price finally breaks above it during the London session. Instead of entering immediately, the trader waits for the breakout candle to close. Price then retests 1.2850, forms a bullish engulfing candle, and continues another 80 pips higher.
This approach reduces exposure to fake breakouts that often appear during quiet Asian trading hours.
Another example comes from USD/JPY during a Non-Farm Payroll (NFP) release. When testing this on volatile NFP days, many breakout signals appeared within minutes. Some produced excellent moves exceeding 120 pips, while others reversed quickly because of rapid news-driven volatility. That experience highlights why traders should widen stop losses carefully during major economic releases or avoid entering until volatility settles.
The indicator also performs well alongside:
- 50-period EMA for trend direction
- RSI (14) to avoid buying overbought breakouts
- Volume indicators to confirm stronger participation
- Price action patterns such as bullish engulfing or pin bars
Trading forex carries substantial risk. No indicator guarantees profits.
Settings, Customization, and Performance
One advantage of this indicator is its flexibility across different trading styles.
Scalpers trading EUR/USD on the M15 chart often reduce the swing calculation period to detect more frequent breakout levels. This creates additional opportunities but also increases false signals during ranging markets.
Swing traders usually prefer H4 or Daily charts with longer lookback settings. These larger support and resistance zones generally produce fewer signals but often carry stronger momentum after a confirmed breakout.
Suggested starting settings include:
Intraday Trading
- Timeframe: M15 or H1
- Swing period: 20–30 candles
- Stop loss: 15–25 pips beyond the breakout level
- Target: Risk-to-reward ratio of at least 1:2
Swing Trading
- Timeframe: H4 or Daily
- Swing period: 50–100 candles
- Stop loss: Below support or above resistance
- Profit target: Next major structure level or 100-200 pips depending on market conditions
No single setting works for every currency pair. GBP/JPY usually requires wider stop losses than EUR/USD because of its larger daily range.
Strengths, Weaknesses, and Comparison with Similar Indicators

The biggest strength of the Support and Resistance Breakout Indicator MT4 is its ability to remove much of the guesswork involved in drawing key price levels manually. It also saves time for traders monitoring several currency pairs at once.
Another benefit is its compatibility with nearly every trading strategy. Trend traders, breakout traders, and swing traders can all use it alongside existing systems.
But there are limitations.
False breakouts remain part of forex trading. During low-volume sessions, price may briefly cross a resistance level before reversing sharply. Choppy markets can also generate multiple losing signals in a short period.
Compared with a standard Pivot Point Indicator, breakout indicators adapt more dynamically to changing market structure instead of relying on fixed daily calculations.
Against Fractal Indicators, breakout tools generally provide clearer entry opportunities because they focus on completed support and resistance zones rather than individual turning points.
Many experienced traders combine this indicator with moving averages instead of replacing them. The moving average identifies trend direction, while breakout signals provide the timing.
After enough chart time, traders usually discover that waiting for candle confirmation produces better long-term results than reacting to every alert.
How to Trade with Support and Resistance Breakout Indicator MT4
Buy Entry

- Buy after a confirmed breakout – Enter only after a 1-hour candle closes 10-15 pips above resistance.
- Wait for a retest – Buy when price retests the broken resistance and forms a bullish candle on EUR/USD H1.
- Trade with the trend – Take buy signals only when the 4-hour trend is already bullish.
- Use a protective stop – Place the stop loss 15-25 pips below the breakout level to limit risk.
- Target the next resistance – Aim for at least a 1:2 risk-to-reward ratio or 40-80 pips.
- Confirm with momentum – Buy only if RSI is above 50 or momentum is increasing.
- Avoid low-volume sessions – Skip breakout trades during quiet Asian market hours to reduce fake-outs.
- Manage position size – Risk only 1-2% of account equity on each breakout trade.
Sell Entry

- Sell after a confirmed breakdown – Enter when a 1-hour candle closes 10-15 pips below support.
- Wait for resistance retest – Sell after the broken support turns into resistance on GBP/USD H1.
- Follow the higher trend – Take sell trades only if the 4-hour or Daily trend is bearish.
- Place a safe stop loss – Keep the stop 15-25 pips above the broken support level.
- Aim for the next support – Target 40-100 pips or maintain a minimum 1:2 risk-to-reward ratio.
- Confirm strong selling pressure – Enter only when bearish momentum increases or RSI stays below 50.
- Avoid major news events – Don’t trade breakouts 15-30 minutes before high-impact news releases.
- Protect your capital – Close the trade early if price quickly moves back above the breakout level.
The Support and Resistance Breakout Indicator MT4 can become a valuable part of a trading plan when it’s used with patience and proper risk management. It helps identify important price zones, highlights potential breakout opportunities, performs well across multiple timeframes, and works effectively alongside price action confirmation rather than replacing it. Traders should remember that market conditions change, and no technical tool predicts every move correctly. Testing the indicator on a demo account, reviewing past breakout behavior, and following disciplined position sizing can help build confidence before risking real capital. Used with realistic expectations, the Support and Resistance Breakout Indicator MT4 offers practical support for traders looking to improve breakout entries while reducing emotional decision-making.
Recommended MT4/MT5 Broker
XM Broker
- *FREE $50 To Start Trading Instantly! (Withdraw-able Profit)
- Deposit Bonus up to $5,000
- Unlimited Loyalty Program
- Award Winning Forex Broker
- Additional Exclusive Bonuses Throughout The Year


>> Sign Up for XM Broker Account here <<
(Free MT4 Indicators Download)




