





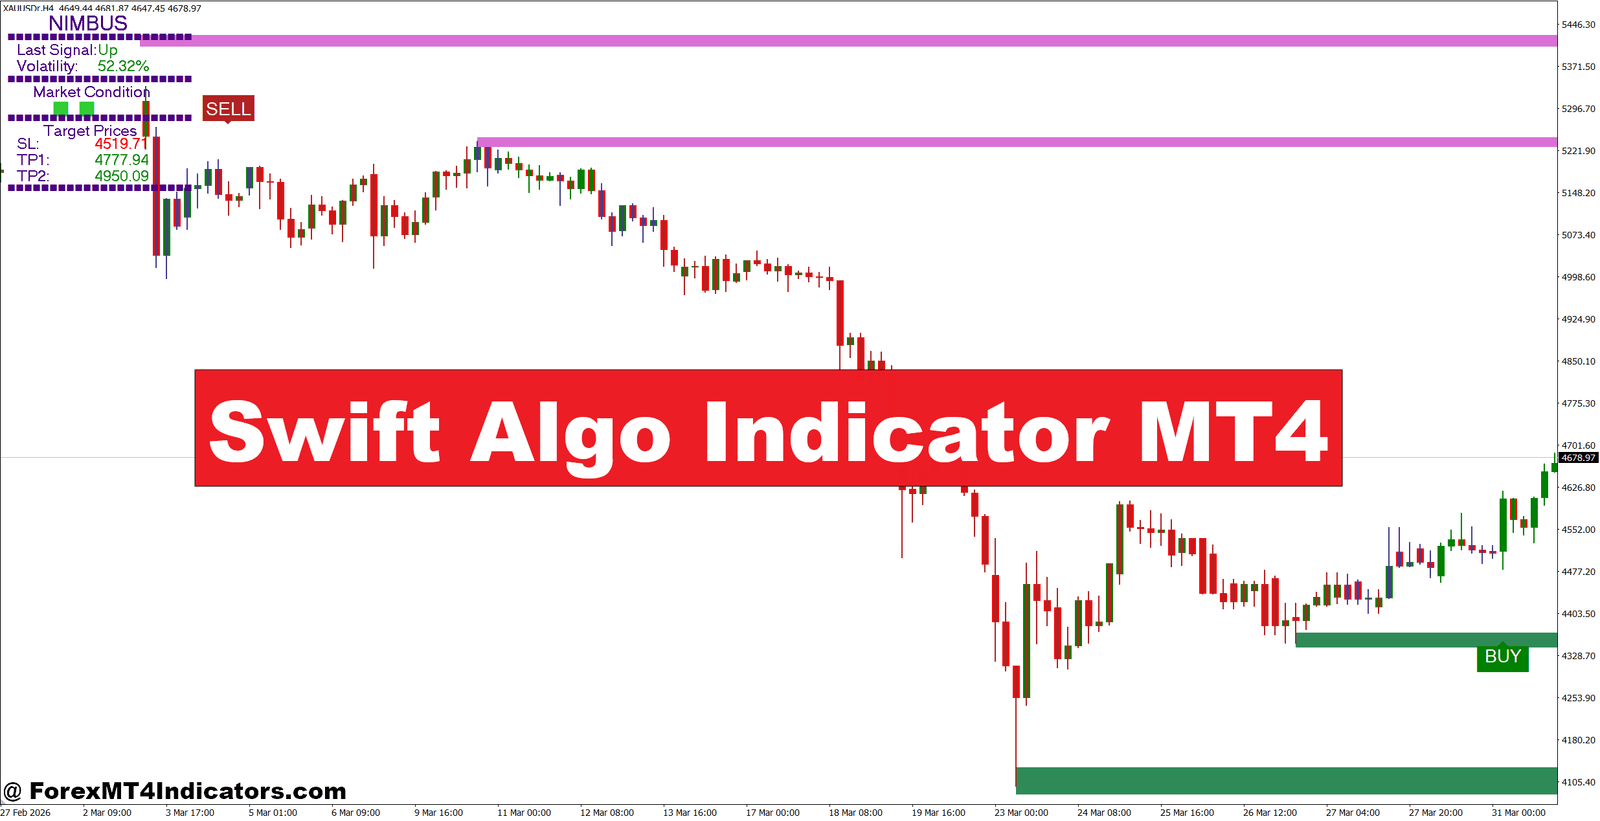
The Swift Algo Indicator MT4 is a technical-analysis tool for MetaTrader 4 that helps traders assess possible buy and sell opportunities. Depending on the specific version or custom settings, it may use price movement, trend calculations, smoothing techniques, and signal conditions to produce directional markers or alerts.
That distinction matters because MT4 indicators with similar names can be programmed differently. There is no single universal calculation formula for every “Swift Algo” release. Traders should check the parameters and source documentation of the exact version they install instead of assuming that every version uses the same algorithm.
In practical trading, the indicator can be treated as a signal filter rather than an automatic trading system. A bullish signal means the market conditions meet the indicator’s internal rules. It doesn’t mean price must rise from that candle.
A better approach is to ask: does the signal agree with the structure of the market?
For instance, suppose EUR/USD is trading above a clear H1 support zone around 1.0820. The pair pulls back 18 pips and the Swift Algo Indicator prints a bullish signal near the support area. If the next candle closes above the previous candle’s high, the setup has more technical support than a bullish signal appearing in the middle of a sideways range.
How Traders Can Read Swift Algo Signals
The useful part of an indicator isn’t simply seeing a green or red marker. Context determines whether that signal deserves attention.
Trend confirmation
Traders can first establish the broader direction on the H4 or H1 chart. If GBP/USD is making higher highs and higher lows on H1, bullish Swift Algo signals during controlled pullbacks deserve more attention than isolated sell signals.
A practical rule could be to wait for at least two forms of confirmation. For example:
- H1 structure remains bullish.
- Price holds a previous support level.
- The indicator produces a buy signal.
- The signal candle closes without a large upper wick.
That combination is stronger than entering immediately after an indicator changes direction.
Support and resistance
Location can make a major difference. A buy signal 5 pips above established support may offer a logical invalidation point. The same signal appearing 40 pips below resistance may have much less room to run.
Consider USD/JPY on the 1-hour chart. If resistance sits near 149.80 and price reaches 149.65 while the indicator produces a buy signal, a trader should consider the remaining upside before entering. A 15-pip gap to resistance isn’t attractive if the planned stop is 20 pips.
Momentum and candle confirmation
A signal becomes more useful when price confirms it. Traders can look for a strong closing candle, a break of a minor swing high or low, or a rejection wick from a known level.
When testing an indicator during volatile NFP sessions, this becomes especially important. A signal can appear during a 30-pip spike and disappear into a 20-pip retracement within minutes. Waiting for the candle to close can reduce some false entries, although it also means accepting a later entry.
Swift Algo Indicator MT4 Settings and Practical Use

The best settings depend on the pair, timeframe, and trading style. There isn’t one setting that should be treated as optimal for every market.
On M15, traders may need faster signal behavior because short-term price changes happen quickly. On H1 and H4, slower settings can help reduce some market noise, but signals may arrive later.
A sensible testing process is to change only one parameter at a time. If the indicator includes sensitivity, period, smoothing, or alert settings, traders can test combinations over at least 50–100 historical setups before deciding whether a change improves results.
For example, a trader testing EUR/USD H1 might record:
- Entry price
- Stop-loss distance
- Take-profit distance
- Signal direction
- Market trend
- Distance from support/resistance
- Maximum favorable movement
- Maximum adverse movement
Suppose 60 historical trades show an average loss of 18 pips and an average winning trade of 32 pips. Even with 45% winning trades, the strategy could still have positive expectancy before trading costs. But if the same indicator produces frequent 8–12 pip whipsaws during Asian-session ranges, a trader may decide to apply it mainly during the London and New York sessions.
That kind of testing is more useful than simply judging an indicator by a handful of winning trades.
Strengths, Limitations, and Comparison With Other Indicators
One advantage of the Swift Algo approach is that it can give traders a visual framework for identifying possible changes in direction. This can be helpful when a chart becomes cluttered with several separate indicators.
Still, it has limitations. Like most technical indicators, it relies on historical price data. A sudden central-bank announcement, NFP release, geopolitical event, or liquidity shock can move price faster than an indicator can react.
There is also the familiar problem of lag. If the calculation uses smoothing, a signal may appear after part of the move has already happened. Faster settings can reduce that delay but may create more false signals.
Compared with the 14-period RSI, Swift Algo signals may provide a more direct directional trigger, while RSI gives traders a clearer view of momentum and overbought or oversold conditions. A moving average is simpler and often better for defining the broad trend, but it can react slowly to reversals.
Support and resistance remain useful alongside any of these tools. An indicator signal in the middle of a range isn’t automatically better than a simple rejection from a well-tested price level.
Here’s the thing: no single indicator can replace market structure. If the H1 chart is trapped between two levels only 25 pips apart, taking every buy and sell signal can lead to repeated losses. In that environment, traders may be better off waiting for a breakout or standing aside.
Position sizing also matters. A trader risking 2% on every signal can suffer a meaningful drawdown during a normal losing streak. Many traders keep risk closer to 0.5–1% per trade while testing a new system, then review the results before increasing exposure.
Trading forex carries substantial risk. No indicator guarantees profits.
How to Trade with Swift Algo Indicator MT4
Buy Entry

- Wait for a clear BUY signal – Enter after the Swift Algo signal appears and the candle closes bullish on the 1-hour chart. Avoid entering on an unfinished candle.
- Confirm the H1 trend – Prefer BUY trades when EUR/USD forms higher highs and higher lows, with price holding above a key H1 support level.
- Check H4 direction – On GBP/USD, favor BUY signals when the 4-hour trend is bullish. Avoid counter-trend entries unless price shows a strong reversal pattern.
- Use 15–25 pip protection – Place the stop-loss below the recent swing low or support zone, typically around 15–25 pips on major pairs.
- Target at least 1:2 risk-reward – If risking 20 pips, aim for roughly 40 pips or more. Don’t take setups with nearby resistance blocking the target.
- Confirm daily structure – A BUY signal has more weight when the daily chart remains bullish and price is trading above major support.
- Risk only 0.5–1% per trade – Keep position size small, especially while testing the indicator or trading during volatile sessions.
- Skip weak BUY signals – Don’t enter when EUR/USD is stuck in a narrow 10–15 pip range or when the signal appears directly below strong resistance.
Sell Entry

- Wait for a confirmed SELL signal – Enter after the signal appears and the candle closes bearish on the 1-hour chart rather than reacting to an intrabar marker.
- Confirm lower highs – Prefer SELL trades on GBP/USD when the H1 chart shows lower highs and lower lows, confirming bearish market structure.
- Check H4 resistance – Look for price rejecting a 4-hour resistance zone before taking a SELL signal. This helps filter trades against the larger trend.
- Set a 15–25 pip stop – Place the stop above the recent swing high or resistance area, adjusting the distance when market volatility increases.
- Aim for 1:2 or better – With a 20-pip stop-loss, look for at least a 40-pip target. Avoid selling when strong support is only 10–15 pips away.
- Review the daily trend – A SELL signal is stronger when the daily chart also shows bearish structure or price remains below major resistance.
- Limit risk to 0.5–1% – A losing streak can happen even with good signals, so position sizing should protect the trading account.
- Avoid SELL signals during spikes – Don’t chase a signal after a sudden 30–50 pip news move. Wait for price to stabilize and form a confirmed setup.
Final Thoughts on the Swift Algo Indicator MT4
The Swift Algo Indicator MT4 can be useful as part of a structured technical-analysis routine, especially when traders combine its signals with trend direction, support and resistance, and candle confirmation. Its main value comes from creating a consistent decision process rather than producing perfect entries.
Three points deserve attention: use higher-timeframe structure to define direction, test settings on the exact pairs and sessions being traded, and keep risk controlled when signals fail. A fourth point is just as important: avoid treating every marker as a trade.
Before putting real money behind the method, traders can test at least 50–100 setups and record the results in a journal. The numbers will show whether the indicator actually fits their trading style. Used with discipline and realistic expectations, it can become one part of a broader MT4 trading system—not the system itself.
Level up your trading
Learn to read the chart — not just the indicator
eBook · Instant PDF
The Candlestick Playbook
Read and trade 40+ candlestick patterns — with exact entries, stops and exits.
Video Course · 12 modules
The Price Action Masterclass
Read clean charts the no-indicator way — pin bars, support & resistance, entries and exits.
Recommended MT4/MT5 Brokers
XM
- ✓ *FREE *$50 to start (withdrawable)
- ✓ Deposit bonus up to $5,000
- ✓ Negative balance protection
Trading forex and CFDs carries a significant risk of loss and is not suitable for everyone. Broker links are affiliate links — we may earn a commission at no cost to you.
Free MT4 Indicator Download


