


AUD/CAD has been grinding higher, but momentum is starting to show subtle cracks beneath the surface.
A recent shift in the underlying rhythm of the move hints that buying pressure may not be as dominant as it once was.
Whether this is just a brief reset or the early stage of a deeper pullback is the question now.
Welcome to “TA Alert of the Day.” Each day after the market close, MarketMilk scans for popular technical indicator alerts. We use these alerts as the basis for a mini-lesson, breaking down what each alert means, why it matters, and how traders might interpret it. The goal is to help beginner traders not only spot these alerts but also understand the logic behind them and how they can inform trading decisions.
What MarketMilk Has Detected
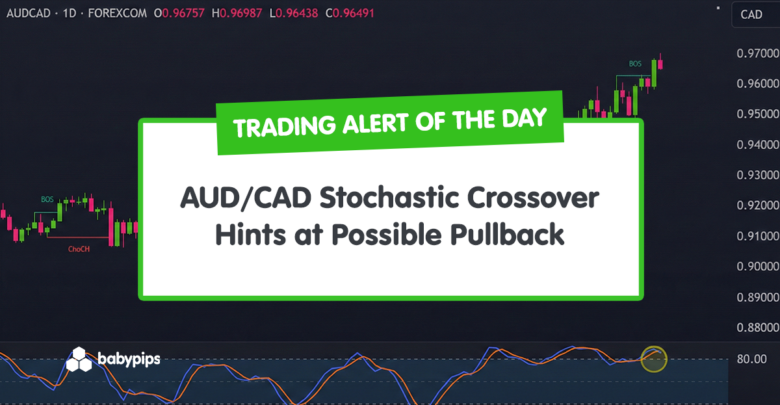
AUD/CAD has transitioned into a clear bullish structure, with price breaking to fresh swing highs and maintaining a sequence of higher highs and higher lows.
The recent move confirms upside continuation after a prolonged basing phase, but momentum is now extended.
On the daily chart, Stochastic (14, 3, 3) %K has crossed below %D while both lines remain in overbought momentum territory (>80).
Specifically, %K moved from 93.36 to 87.84, while %D rose to 90.56, creating a bearish crossover condition.
This develops after a sustained advance from the mid-December lows near 0.9100 into late-January/early-February highs around 0.9699.
Price is also pulling back from the recent swing area, with nearby support zones visible around 0.9590–0.9579 and then 0.9509–0.9488.
What This Signals
A bearish Stochastic crossover from overbought levels often marks cooling upside momentum and can attract profit-taking, especially after an extended run.
If the move is sustained, it suggests that recent buying pressure is becoming less dominant and that the market may be transitioning from acceleration to consolidation or a deeper pullback.
However, this same pattern can also represent a routine pause within a strong trend.
In trending conditions, Stochastic can remain elevated for extended periods, and bearish crosses above 80 sometimes occur just before price resumes higher, particularly where prices briefly dip into prior breakout zones and then rebound.
The outcome depends heavily on trend structure, where price is relative to prior resistance/support, and whether follow-through selling appears over the next few sessions.
How It Works
The Stochastic oscillator (14, 3, 3) compares the latest close to the recent 14-period range to gauge momentum.
The %K line is the faster measure, while %D is a smoothed signal line; a cross of %K below %D indicates momentum is shifting lower versus its recent baseline.
Important: “Overbought” on Stochastic describes overbought momentum, not valuation. In persistent uptrends, overbought readings can stay elevated and produce multiple bearish crosses that do not lead to meaningful declines.
What to Look For Before Acting
Do not assume the crossover guarantees a reversal. Consider these factors:


Risk Considerations

Potential Next Steps
Stochastic is near overbought levels, reflecting strong upside momentum.
While this increases the probability of short-term consolidation, it does not automatically signal a reversal in a trending market. In strong trends, oscillators can remain elevated for extended periods.
Keep AUD/CAD on a watchlist for confirmation via price.
For example, a daily close below 0.9590–0.9579 or continued weakness that turns prior support into resistance on a retest.
Alternatively, if price stabilizes and reclaims the recent high area, treat the crossover as a potential momentum reset rather than a reversal.
Whichever scenario develops, consider defining invalidation levels around nearby structure (recent swing highs/lows) and sizing risk for typical daily FX volatility rather than relying on the oscillator alone.
Trade Idea (Short)
Setup:
Sell AUDCAD after an extended upside run into the 0.9680–0.9700 resistance zone, where price is stretched above prior structure and momentum is elevated.
Stochastic is near overbought territory, increasing the probability of a pullback or short-term mean reversion following the recent breakout leg.
Entry:
Stand aside and wait for signs of exhaustion near 0.9680–0.9720, such as:
Alternatively, if price breaks below 0.9580–0.9600 (the most recent breakout support), enter short on a weak retest of that level from underneath, confirming a failed breakout.
Stop Loss:
If entering near 0.9700 resistance, place the stop on a daily close above 0.9750, which would signal continuation rather than a pullback.
If entering on a breakdown below 0.9580, place the stop above 0.9630–0.9650, just back inside the prior structure.
Take Profit:
Target the 0.9500–0.9520 zone as the first take-profit area, corresponding to the last higher low and consolidation shelf.
If downside momentum accelerates, trail stops and look for extension toward 0.9400–0.9450, where broader structural support sits.
Trade Idea (Long)
Setup:
Buy AUDCAD if it pulls back to a level that used to be resistance but is now acting as support.
Since the overall trend is still up, the recent pause might be simply consolidation before another move higher.
Entry:
Stand aside and wait for AUDCAD to pull back into the 0.9580–0.9620 zone, where prior resistance has flipped into support.
Look for stabilization through tight daily ranges, a higher low formation, or a bullish reversal candle holding above this zone.
Enter long once price confirms support by turning back higher from this area, rather than chasing the current extension near 0.9700.
Stop Loss:
Place the stop on a daily close below 0.9550. A decisive break below this level would signal a failed breakout and increase the probability of a deeper retracement toward 0.9500.
Take Profit:
Target the 0.9750–0.9800 zone as the first take-profit area, representing psychological resistance and measured extension from the recent breakout.
If price consolidates above that level, trail stops and look for continuation toward 0.9900 over time.
Bottom line:
AUDCAD is in a confirmed uptrend, but short-term conditions are extended. A bearish rejection at 0.9700 or a failed breakout below 0.9580 would open the door to a corrective move lower before the broader trend potentially resumes.
This content is strictly for informational purposes only and does not constitute as investment advice. Trading any financial market involves risk. Please read our Risk Disclosure to make sure you understand the risks involved.


