


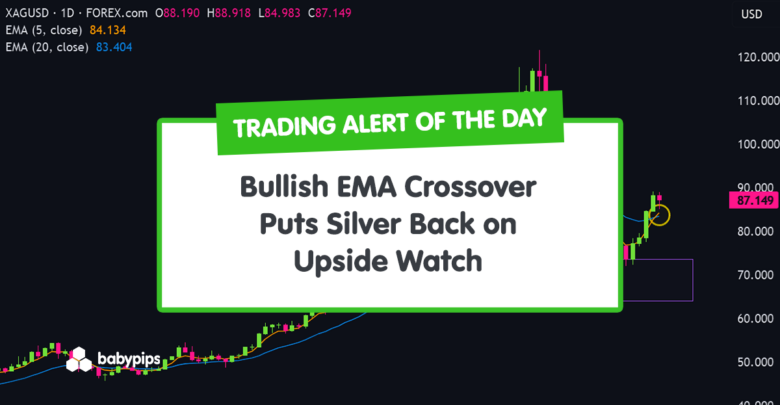
Silver (XAG/USD) has printed a classic short-term moving average shift that often shows up near potential turning points.
Even with today’s red close, the overall moving average structure has improved enough to trigger a bullish crossover!
The next few sessions will help reveal whether this is a genuine bullish trend transition or a brief rebound within a wider consolidation.
Welcome to “TA Alert of the Day.” Each day after the market close, MarketMilk scans for popular technical indicator alerts. We use these alerts as the basis for a mini-lesson, breaking down what each alert means, why it matters, and how traders might interpret it. The goal is to help beginner traders not only spot these alerts but also understand the logic behind them and how they can inform trading decisions.
What MarketMilk Has Detected
Tthe EMA(5) has crossed above the EMA(20), with the relationship flipping from 82.59 below 83.00 (prior bar) to 84.11 above 83.39 (current bar).
This crossover is notable because it follows a sharp selloff from the late-January peak area (highs near 121.67) into early-February lows around the 70–73 region, then a rebound back toward the mid/upper 80s.
Silver crashing from its high was covered here: The Silver Crash Explained: What Actually Happened and What’s Next
Price is currently consolidating below recent resistance around 88.93–89.17 (recent highs) while holding well above the early-February swing low band (70.69–73.97 area).
The crossover suggests short-term price action has strengthened relative to the last few weeks of trading.
What This Signals
Traditionally, a 5 EMA crossing above the 20 EMA suggests that recent price action is accelerating faster than the broader short-term baseline.
If the move is sustained, this development can attract trend-following participation and often marks the early stages of a push back toward prior supply zones, such as the 90–95 region (seen multiple times in January/February).
However, this same pattern can also represent a late crossover after a rebound has already occurred—especially in volatile markets.
In that case, price sometimes coincides with a bull-trap style move where prices briefly hold above the averages, then roll back under nearby resistance (such as 88.9–89.2) and revert toward the mid-range supports (around 84.4 and the broader 79–80 zone).
The outcome depends heavily on follow-through price action, where the crossover occurs relative to key support/resistance, and broader volatility conditions.
Context and confirmation are essential, particularly given the large recent swing from 121.67 down into the 70s and back toward the upper-80s.
How It Works
The Exponential Moving Average (EMA) weights recent prices more heavily than older prices, making it more responsive to fresh momentum.
A 5-period EMA tracks very short-term movement, while the 20-period EMA acts as a smoother short-term trend reference.
When the faster EMA moves above the slower EMA, it means recent prices are rising faster than the longer-term trend, showing short-term momentum is starting to strengthen.
Important: EMA crossovers are lagging signals and can whipsaw during range-bound or high-volatility conditions. Reliability often improves when the crossover is accompanied by a clean break/hold above nearby resistance and when price remains above the 20 EMA on subsequent closes.
What to Look For Before Acting
Do not assume a sustained uptrend. Consider these factors:


Risk Considerations

Potential Next Steps
Short-term momentum has improved, with price climbing steadily off the base. However, the rally lacks strong expansion candles and remains choppy.
Consider keeping XAG/USD on a watchlist for whether price can hold above the 20 EMA and build acceptance above 88.9–89.2.
Acceptance means the market has found a temporary fair value. Because both buyers and sellers are comfortable trading at this level, the price does not immediately spike or crash.
It signals that the market is comfortable with that price level, forming a stable base (balance zone) that often leads to future support.
If you trade crossovers, wait for confirmation such as a follow-through close and/or a retest that respects the 20 EMA as support.
Whatever the approach, position sizing and clearly defined exit logic matter more than usual in a market that has recently shown very large daily ranges.
Trade Idea (Bullish Continuation Scenario)
Setup:
Look for continuation higher if price can break and hold above 90, confirming strength above the 20-EMA.
Entry:
Enter long on a daily close above 90, or on a controlled pullback that holds above 85–87 after a breakout.
If price fails at 90 and prints a clear bearish rejection candle, stand aside and wait for either a deeper pullback toward 80 or a confirmed breakout later.
Stop Loss:
Place the stop on a daily close below 80 for breakout entries.
For pullback entries, use a daily close below 82 as invalidation.
Take Profit:
First target: 100.
Second target: New all-time highs if upside momentum expands.
Bottom line:
Silver is stabilizing after a violent correction. The 65–75 zone held, and price is attempting to reclaim short-term moving averages. A confirmed break above 90 would favor bullish continuation toward 95–100, while rejection there would suggest the corrective phase is not yet complete.
This content is strictly for informational purposes only and does not constitute as investment advice. Trading any financial market involves risk. Please read our Risk Disclosure to make sure you understand the risks involved.


