


EUR/CHF is attempting to stabilize after a multi-week slide, and momentum readings are starting to shift.
While the price move is still modest, the latest MACD development suggests the downside pressure may be easing.
Traders will often watch closely at this stage because follow-through (or lack of it) can be revealing.
Welcome to “TA Alert of the Day.” Each day after the market close, MarketMilk scans for popular technical indicator alerts. We use these alerts as the basis for a mini-lesson, breaking down what each alert means, why it matters, and how traders might interpret it. The goal is to help beginner traders not only spot these alerts but also understand the logic behind them and how they can inform trading decisions.
What MarketMilk Has Detected
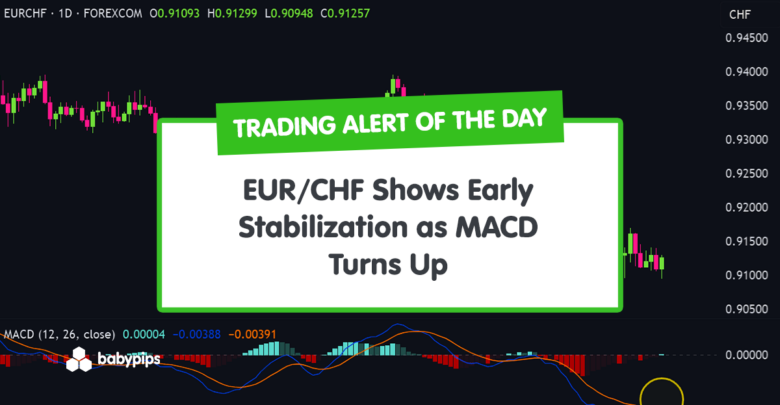
EUR/CHF has triggered a bullish MACD(12,26,9) crossover on the daily timeframe, with the MACD line moving above its signal line.
This crossover is occurring while MACD values remain below zero, which typically frames the move as an early momentum shift rather than a fully established uptrend.
Based on the chart, EUR/CHF peaked near 0.9396 in early December before trending lower into late January, printing lows around the 0.9146–0.9160 area and then extending down toward 0.9095–0.9102 in February.
The current close near 0.9125 places the price back in a zone that has recently acted as a short-term pivot, with nearby resistance appearing around 0.9145–0.9160.
What This Signals
Traditionally, a MACD line crossing above the signal line suggests that downside momentum is fading and that buyers are beginning to regain influence.
If the move is sustained, this kind of crossover can attract trend-followers looking for a developing recovery phase, especially if price can reclaim nearby resistance bands such as 0.9145–0.9160 and hold above them on subsequent closes.
However, this same pattern can also represent a counter-trend bounce within a broader decline.
Because the MACD is still below the zero line, the crossover sometimes coincides with brief relief rallies that stall into resistance, particularly where prices briefly push higher and then roll back over, creating a “whipsaw” crossover that quickly reverses.
The outcome depends heavily on follow-through price action, where the crossover occurs relative to support/resistance, and whether momentum can continue improving (for example, via a rising MACD histogram and expanding positive spread between MACD and signal).
How It Works
The MACD (Moving Average Convergence Divergence) compares two exponential moving averages (typically 12 and 26 periods) to measure momentum.
The “signal line” is a smoothed average (commonly 9 periods) of the MACD line.
A bullish signal occurs when the MACD line crosses above the signal line, indicating that recent momentum is improving relative to its recent baseline.
Important: MACD is a lagging indicator and can produce false starts in choppy or range-bound markets. Crossovers that occur below the zero line often behave differently than those above it; they can be early warnings of stabilization, but they typically require stronger confirmation from price structure and subsequent momentum expansion.
What to Look For Before Acting
Do not assume a trend reversal is underway. Consider these factors:


Risk Considerations

Potential Next Steps
Add EUR/CHF to a watchlist and monitor whether price can build acceptance above 0.9145–0.9160 while the MACD histogram remains positive.
If confirmation is limited, consider waiting for additional structure (such as a higher-low / higher-high sequence) rather than treating the crossover alone as sufficient.
For risk management, it can help to pre-define invalidation around the 0.9095–0.9100 area (recent lows) and size positions with the pair’s recent daily ranges in mind.
This keeps the focus on process and confirmation rather than assuming the signal guarantees follow-through.
Trade Idea (Tactical Support Bounce)
Setup:
Buy EURCHF if the 0.9100–0.9120 support zone holds and momentum begins to turn.
Entry:
Wait for the price to stabilize above 0.9100 and show a bullish daily candle or higher low formation.
Enter long on a push back above 0.9150–0.9160, signaling buyers are stepping in.
If price breaks and closes decisively below 0.9100, stand aside. That would invalidate the bounce thesis and favor continuation toward 0.9050–0.9000.
Stop Loss:
Place the stop on a daily close below 0.9050.
Take Profit:
First target: 0.9200.
Second target: 0.9250–0.9300 if momentum expands.
Bottom line:
EURCHF is still structurally bearish, but it is testing key support while momentum slows. If 0.9100 holds and MACD improves, a tactical rebound toward 0.9200–0.9250 is possible. A break below 0.9100 shifts the bias back to continuation lower.
This content is strictly for informational purposes only and does not constitute as investment advice. Trading any financial market involves risk. Please read our Risk Disclosure to make sure you understand the risks involved.


