


USD/JPY has backed off its recent highs and is now sitting right on a support area.
This area is shaping up to be a bit of a make-or-break spot.
Traders are watching closely to see if the recent selling is running out of steam or just taking a quick pause before another push lower.
With volatility still hanging around and macro themes in the mix, how the price reacts here could set the tone for the next move.
Is this where USD/JPY finds its footing, or is there more downside ahead?
Welcome to “TA Alert of the Day.” Each day after the market close, MarketMilk scans for popular technical indicator alerts. We use these alerts as the basis for a mini-lesson, breaking down what each alert means, why it matters, and how traders might interpret it. The goal is to help beginner traders not only spot these alerts but also understand the logic behind them and how they can inform trading decisions.
What MarketMilk Has Detected
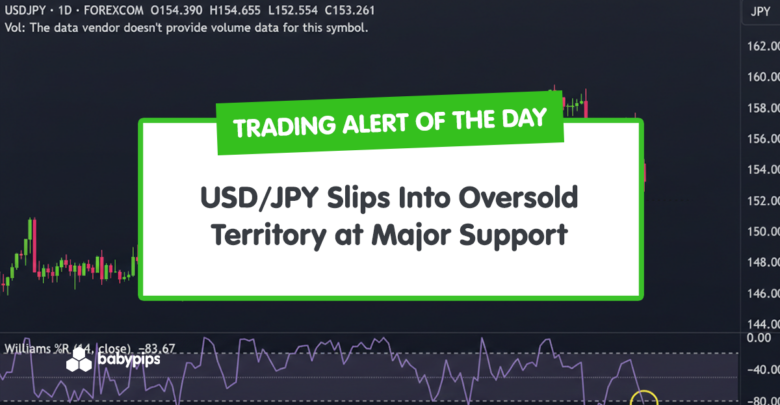
Williams %R (14) has dropped into oversold territory, printing -83.71 after crossing below the -80 threshold.
This coincides with a renewed pullback from the late-January/early-February rebound, as the price fell from the 157 area back toward the mid-153s.
Looking at the chart, similar oversold readings appeared during the sharp selloff into 152.10–152.55 (late January) and again near the mid-154s (mid-December).
Nearby levels from recent trading include potential support around 152.10–152.55 and overhead supply/resistance in the 155.60–156.30 area, with a higher resistance band around 157.15–159.45.
The recent lower high near 157–158, combined with renewed selling pressure, suggests short-term trend deterioration.
While the broader multi-month bullish structure is not fully broken yet, the immediate bias has clearly shifted from trend continuation to a sharp pullback.
What This Signals
Traditionally, a Williams %R oversold signal suggests that downside momentum has become stretched, which can attract mean-reversion buyers if the price stabilizes.
If the move is sustained (i.e., momentum improves while price holds key supports), it often marks conditions where a short-term rebound or consolidation becomes more likely than continued one-way selling.
However, this same pattern can also represent trend strength rather than exhaustion.
In strong downswings, Williams %R can stay oversold for multiple sessions while price continues to grind lower, and brief bounces can fail quickly (a common “oversold trap”).
This is especially relevant if USD/JPY loses the 152.55 area and re-tests the late-January low zone near 152.10.
The outcome depends heavily on follow-through in price action, the broader trend context, and whether USD/JPY can hold or reclaim nearby support/resistance zones.
How It Works
Williams %R is a momentum oscillator that compares the latest close to the high-low range over the past 14 periods.
It moves between 0 and -100, where readings below -80 indicate oversold momentum (price closing near the lower end of its recent range) and readings above -20 indicate overbought momentum.
Important: Oversold momentum does not automatically mean the price must reverse. Oscillators are most reliable when paired with support/resistance, evidence of seller exhaustion (smaller real bodies, failed pushes lower), and confirmation that momentum is actually turning (e.g., Williams %R rising back above -80).
What to Look For Before Acting
Do not assume a rebound is guaranteed. Consider these factors:


Risk Considerations

Potential Next Steps
Williams %R is in oversold territory (below -80), reflecting strong downside momentum. While oversold readings can produce sharp bounces, they do not automatically signal reversals.
The key question is whether support at 152 produces absorption and stabilization, or whether momentum pushes through and confirms a broader corrective phase.
Keep USD/JPY on a watchlist for signs of stabilization around 152.55 and for Williams %R to begin recovering back above -80.
If a bounce develops, monitor how the price behaves into 154.65 and then 155.60–156.30 for acceptance vs rejection.
If price instead breaks and holds below support, consider waiting for a new base or reversal structure before treating “oversold” as actionable, and use position sizing and invalidation levels to manage whipsaw risk.
Trade Idea (Long)
Setup:
Buy USDJPY on stabilization at the major 152.00 horizontal support, which marks a prior breakout level and key structural pivot.
Williams %R is oversold (below -80), suggesting downside momentum may be stretched and vulnerable to a relief bounce if support holds.
Entry:
Stand aside and wait for USDJPY to hold above 151.80–152.20 and show signs of stabilization.
Look for confirmation such as:
- A bullish reversal candle (long lower wick or bullish engulfing),
- A higher low forming above 152,
- Or Williams %R turning back up out of oversold territory.
Enter long once price confirms support by closing back above 153.00–153.50, signaling that buyers are stepping in.
Stop Loss:
Place the stop on a daily close below 151.50. A decisive break below this level would invalidate the support-hold thesis and increase the probability of a deeper corrective move.
Take Profit:
Target the 155.50–156.50 zone as the first take-profit area, corresponding to the recent breakdown pivot and lower high.
If price consolidates above that level, trail stops and look for continuation toward 158.00–159.00, where major overhead resistance and the prior swing high reside.
Trade Idea (Short)
Setup:
Sell USDJPY on a confirmed breakdown below the 152 support zone, aligning with the “lower high” structure.
Entry:
Stand aside and wait for a daily close below 151.50, confirming that the horizontal support has failed.
Alternatively, if price breaks below 152 and then retests it from underneath (support turning into resistance), enter short on a bearish rejection from the 151.80–152.20 area.
Stop Loss:
Place the stop on a daily close back above 153.50, which would signal a failed breakdown and potential return to range trade.
Take Profit:
Target the 149.50–150.00 zone as the first take-profit area, corresponding to prior consolidation and psychological support.
If downside momentum persists, trail stops and look for extension toward 147.50–148.00, where a deeper retracement of the broader uptrend would likely find buyers.
Bottom line:
Momentum is bearish in the short term, and a confirmed break of 152 would shift the bias decisively lower. Until that level breaks, however, the market remains in indecision mode, with the risk of both a breakdown and a sharp oversold bounce.
This content is strictly for informational purposes only and does not constitute as investment advice. Trading any financial market involves risk. Please read our Risk Disclosure to make sure you understand the risks involved.


