Wednesday, March 25


The Dow Industrial average was the best of the worst of the major US indices in 2022.

For the year, the major indices
Indices

Stock market indices represents an index that measures a particular stock market or a segment of the stock market. These instruments are important investors as they help compare current price levels with past prices to calculate market performance.The main two parameters for indices are that they are both investable and transparent. For example, investors can invest in a stock market index by buying an index fund, which is structured as either a mutual fund or an exchange-traded fund, and track an index. The difference between an index fund’s performance and the index, if any, is called tracking error. Most major countries boast multiple indices. Commonly traded indices include the S&P 500, NASDAQ-100, Dow Jones Industrial Average (DIJA), EURO STOXX 50, Hang Seng Index, and many more.Stock market indices can be characterized or segmented by the index coverage set of stocks. The overall coverage of an index constitutes an underlying group of stocks, most commonly grouped together by underlying investor demand.How to Trade IndicesRetail brokers offer indices exposure through the use of contracts-for-difference (CFDs) or exchange-traded funds (ETFs). Each are popular ways to trade specific markets and are almost always on offer at most brokers.Investors can choose between multiple types of indices that traditionally fall within several categories. This includes country coverage, regional coverage, global coverage, exchange-based coverage, and sector-based coverage.All indices are ultimately weighted in a number of different ways. The most common mechanisms include market-capitalization weighting, free-float adjusted market capitalization weighting, volatility weighting, price weighting, and others.

Stock market indices represents an index that measures a particular stock market or a segment of the stock market. These instruments are important investors as they help compare current price levels with past prices to calculate market performance.The main two parameters for indices are that they are both investable and transparent. For example, investors can invest in a stock market index by buying an index fund, which is structured as either a mutual fund or an exchange-traded fund, and track an index. The difference between an index fund’s performance and the index, if any, is called tracking error. Most major countries boast multiple indices. Commonly traded indices include the S&P 500, NASDAQ-100, Dow Jones Industrial Average (DIJA), EURO STOXX 50, Hang Seng Index, and many more.Stock market indices can be characterized or segmented by the index coverage set of stocks. The overall coverage of an index constitutes an underlying group of stocks, most commonly grouped together by underlying investor demand.How to Trade IndicesRetail brokers offer indices exposure through the use of contracts-for-difference (CFDs) or exchange-traded funds (ETFs). Each are popular ways to trade specific markets and are almost always on offer at most brokers.Investors can choose between multiple types of indices that traditionally fall within several categories. This includes country coverage, regional coverage, global coverage, exchange-based coverage, and sector-based coverage.All indices are ultimately weighted in a number of different ways. The most common mechanisms include market-capitalization weighting, free-float adjusted market capitalization weighting, volatility weighting, price weighting, and others.
Read this Term
showed:

What stocks in the Dow 30 eased the declines in 2022?

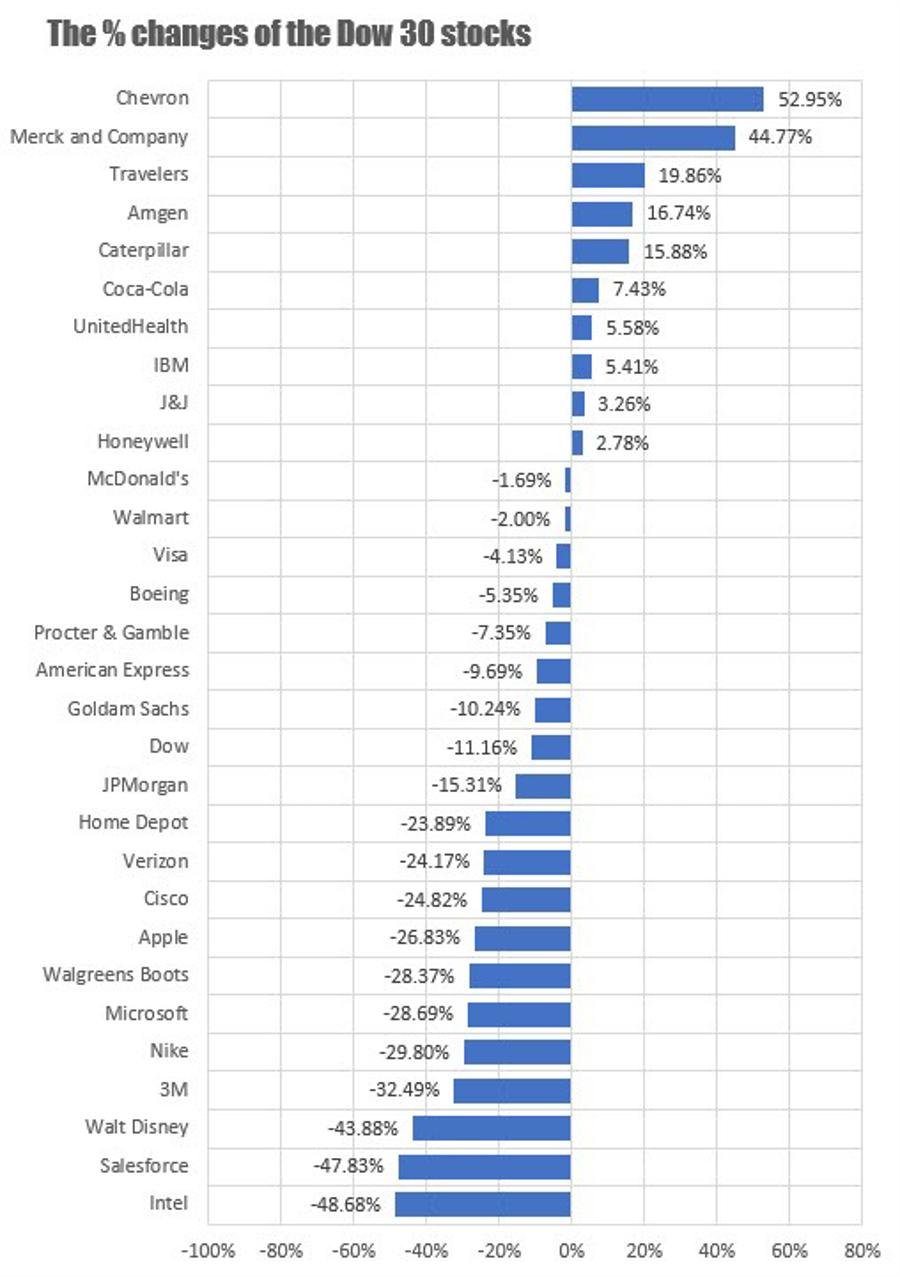
The chart below shows the % gains and loses of the major stocks in the Dow Industrial average. There were a total of 10 stocks which showed gains for the year led by Chevron which gained 52.95%. The biggest loser was Intel which fell -48.68%. A total of 11 stocks fell over 20% including Apple (down -26.83), Microsoft (-28.69%), Disney (-43.88%).

The % YoY changes for the Dow 30 in 2022

The newest addition to the Dow, Salesforce tumbled -47.83%. Salesforce was added on August 31, 2020 and replaced Exxon Mobile. Exxon Mobile was one of the strongest stocks in 2022 with a gain of 80.26%. Since August 31, 2020 when Exxon Mobile was kicked out of the Dow 30, the stock is up 176%.

How has Salesforce fared over the same time period?

Saleforce shares are down -51.3% since being added to the Dow 30.

I wonder how the math would have worked out for the Dow if that switch was not made? Would the Dow have showed a gain in 2022?

Looking at the broader S&P index, the S&P escaped a 20% decline in 2022, but just barely. The S&P fell -19.44% on the year which was the largest decline since 2008, when the index fell -38.49%.

The decline this year was the 4th worst going back to 1974. However, of note is after each sharp decline year, there was a sharp rise the very next year

  • In 1974 the index fell -29.74%. In 1975, the index rose 31.55%
  • In 2002, the index fell -23.37%. In 2003, the index rose 26.38%
  • In 2008, the index fell -38.49%. In 2008, the index rose 23.45%

Something to think about in 2023.

Looking at the 11 components of the S&P index, the energy component was the only gainer with a rise of 59.04%. The Communications and Consumer discretionary were the worst performers with declines of -40.42% and -37.58% respectively.

The gains and loses for the 11 S&P components in 2022


Source link

Share.
FX

Leave A Reply