


Eight weeks. No losing week since late March. The S&P 500 just logged its longest winning streak since December 2023, touched fresh highs above 7,540, then pulled back.
Could it mean that the rally is running out of steam and about to fade?
Find out what this equity index wobble at the top could mean for the forex market and overall sentiment.
What Actually Happened?
The S&P 500 gained 0.9% in the week ending May 22, marking its eighth straight weekly gain. This Tuesday, it hit record territory above 7,540, then gave back roughly 35 points before the close. The same thing happened the day before.
The 7,534–7,544 zone has now turned buyers away twice this week, even as Goldman Sachs raised its year-end target to 8,000, and investor confidence is on a high.
Before we attempt to understand why, here are four terms you’ll need to know:
- Momentum — when something’s been moving in one direction, it tends to keep moving that way for a while
- Resistance — a price level where sellers keep showing up and stopping the advance cold
- Mean reversion — prices that stretch far from their long-run average eventually get pulled back toward it
- Risk sentiment — the market’s mood dial. Risk-on means traders are buying equities, high-yield currencies, and commodities. Risk-off means they’re running toward safety: bonds, yen, dollars, and usually gold
Why Did the Market Run This High?
It didn’t happen by accident, and it wasn’t from a single thing.
AI earnings carried the heaviest load. Earnings growth for Q1 2026 marked the sixth straight quarter of double-digit gains, with 88% of S&P 500 companies beating estimates against a five-year average of 78%. Nvidia alone gained roughly 19% year-to-date through late May, and companies building AI infrastructure kept delivering. Quarter after quarter of that stacks up.
Oil also helped, but in a quieter way. Prices fell through most of the streak, which eased fears that inflation would re-accelerate and force the Fed to sit on rates longer. The decline in energy costs led stagflation fears to fade, easing direct tailwinds to spending. Less Fed pressure to hike means equities breathe easier.
Then there was the VIX, which is the market’s fear gauge, hovering near its lowest level since early February. Early 2026 equity gains were concentrated mostly in mega-cap tech, before other sectors eventually joined, reflecting broadening investor confidence.
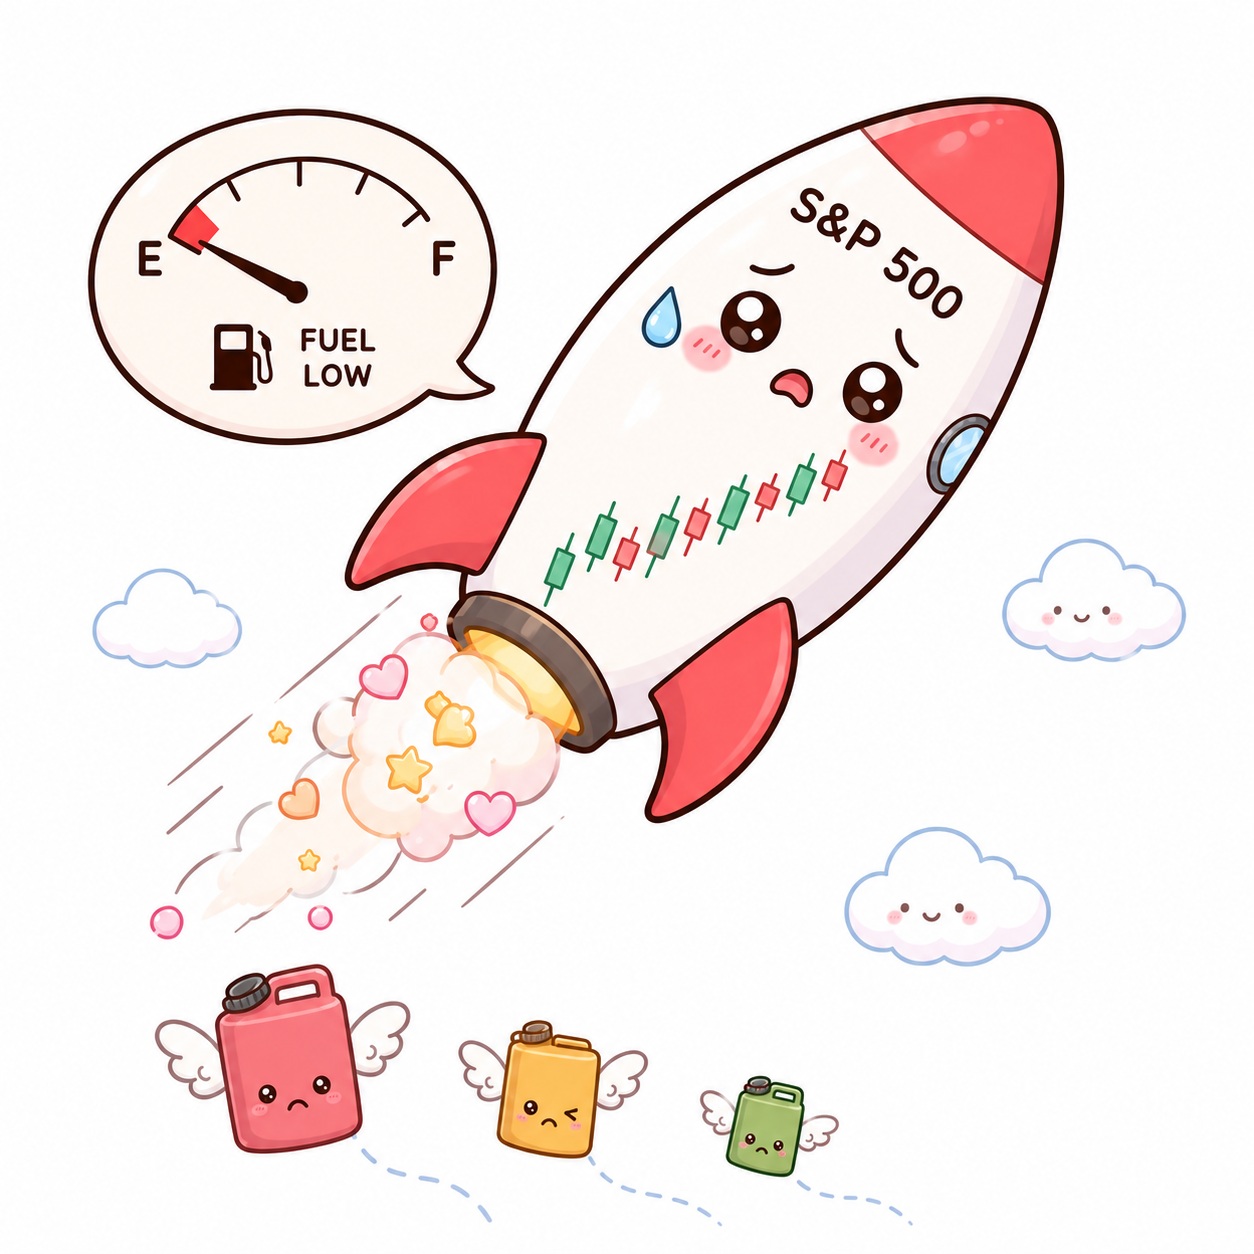
But momentum is fuel. And fuel can run out.
Promoted: When the S&P 500 index is on a hot winning streak but appears to be hitting a snag, traders need to pay close attention to make-or-break market factors more than ever.
Maven Trading provides simulated funding challenges starting as low as $15, allowing you to trade major pairs with professional-sized capital. No time limits mean you can wait for cleaner setups around headlines and equity-driven moves without the pressure of a ticking clock.
Learn More About Maven Trading Today!
Disclosure: We may earn a commission from our partners if you sign up through our links, at no extra cost to you.
Why Is It Stalling Now?
Three factors offer possible interconnected explanations for the rally appearing to run out of steam:
The 7,534–7,544 cluster has rejected price twice in one week. Sellers are arriving at that zone in enough size to absorb whatever buying pressure tries to push through. Some are locking in profits from a two-month run. Others are watching Thursday’s calendar and deciding record-high risk isn’t worth carrying into a data minefield.
Thursday’s U.S. data bombshell, with the Q1 GDP and April core PCE due in the same session, seems to be putting traders on edge. A hot GDP and a hot PCE reading likely kill near-term rate-cut hopes and give sellers exactly the excuse they’ve been waiting for. A soft combination flips it: rate-cut optimism returns, bulls get their catalyst, and the streak could continue.
Mean reversion is lurking. The S&P 500 is trading well above its 200-day moving average, which sits near 7,000. That gap means the index needs constant fresh fuel to stay at altitude.
What Do All These Mean for Forex?
Equities and currencies don’t trade in separate universes. Risk sentiment bleeds across every asset class, and the S&P 500 is one of the cleanest real-time signals for which direction sentiment is tilting.
Risk-on means traders are comfortable. They buy equities, sell safe-haven currencies, chase yield.
Risk-off is the opposite: equities drop, safe havens catch bids, and the mood shifts.
Three pairs that could feel this most:
- USD/JPY is essentially a risk-sentiment barometer right now. The yen is a classic safe-haven — when markets get nervous, investors who borrowed cheaply in yen to fund higher-yielding trades (the carry trade) rush to close those positions, buying yen back and pushing USD/JPY lower.
- AUD/USD tracks risk appetite closely because Australia’s economy lives and dies by global growth and commodity demand. Risk-on environments tend to lift AUD. Risk-off environments drag it.
- EUR/USD has a looser equity link, but a strong dollar, which tends to emerge in risk-off selloffs, pushes EUR/USD lower regardless.
The Bottom Line
The S&P 500 is on its longest winning streak since December 2023, driven by AI earnings, falling oil, and broader sector participation.
The rally has stalled around 7,534-7,544 twice this week to suggest that sellers are starting to show up and that buyers need stronger reasons to push through the roadblock.
That fuel for bullish momentum could come on Thursday, as the U.S. economy gears up to print its Q1 GDP report and the core PCE price index, which could make or break Fed tightening expectations. Another factor to watch is the US-Iran negotiations through Qatari mediation, as a signed peace deal pulls one major uncertainty off the table and could also provide another catalyst for a leg higher.
The S&P 500’s stalling rally and what it means for forex pairs like USD/JPY and AUD/USD can be hard to follow if you’re not familiar with how equity markets and currencies interact. Premium members can read our lesson:
Equities and Currencies: The Big Picture Reading this helps you understand how risk sentiment flows between stock markets and currencies, which pairs react most to equity moves, and why a wobble in the S&P 500 can shift the direction of your forex trades.
And if you’re not a Premium subscriber yet, now’s a good time to sign up.
With Babypips Premium, you get full access to School of Pipsology lessons that help you understand not just what’s happening in equities, but how those moves translate directly into currency flows and forex trade setups.