


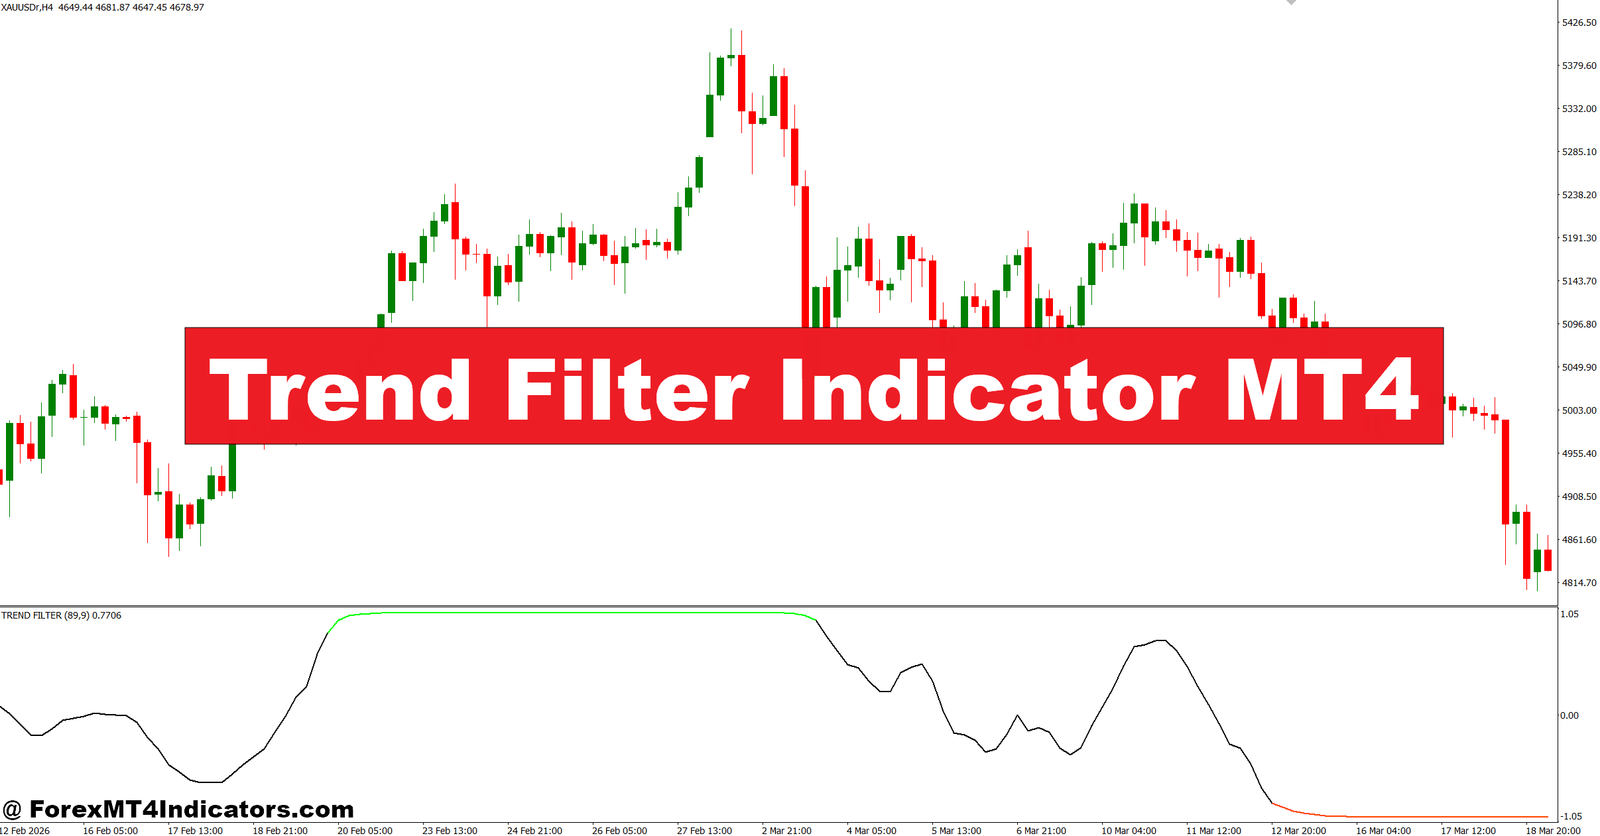
The Trend Filter Indicator MT4 was created to reduce that problem by helping traders identify the market’s dominant direction before opening a position. Instead of reacting to every price swing, it encourages traders to focus on setups that match the prevailing trend.
Following the larger market direction doesn’t eliminate risk, but it often removes many low-quality trades that happen during sideways conditions. That can improve consistency and help traders stay disciplined. A trend filter works best when combined with solid price action and proper risk management rather than acting as a stand-alone signal generator. The sections below explain how this indicator works, where it performs well, and what traders should know before adding it to their trading plan.
What Is the Trend Filter Indicator MT4?
The Trend Filter Indicator MT4 is a technical analysis tool that separates trending markets from ranging markets. Its main purpose is simple: show traders whether buying or selling has the higher probability based on current market direction.
Most versions rely on moving averages, price smoothing techniques, or momentum calculations to determine trend strength. Some display colored lines that change with the trend, while others paint the chart background or show arrows when the direction shifts.
Unlike oscillators that constantly move between overbought and oversold levels, a trend filter focuses on direction instead of short-term exhaustion. This makes it useful for swing traders, intraday traders, and position traders who prefer to trade with market momentum.
Many traders combine the indicator with support and resistance zones, candlestick confirmations, or breakout strategies to improve trade quality.
How the Indicator Determines Market Direction

Every Trend Filter Indicator MT4 version has its own formula, but most follow similar logic.
First, the indicator measures recent price movement over a selected number of periods. It then smooths market noise using averages or adaptive calculations. When buying pressure becomes stronger than selling pressure, the indicator signals an uptrend. When selling pressure dominates, it switches to a downtrend.
Some advanced versions also include volatility filters. During low-volatility periods, the indicator delays trend changes to avoid frequent whipsaws.
Here’s a practical example.
On the EUR/USD 1-hour chart, price closes above the 200-period moving average while the Trend Filter Indicator changes from red to blue. At the same time, the market forms a higher low near a previous support level. Instead of buying immediately after the color change, traders often wait for the next bullish candle to close before entering. This small confirmation helps avoid many false breakouts.
During testing on volatile NFP release days, traders may notice the indicator changes direction several times within minutes. Waiting until the market settles often produces cleaner signals than reacting to the first trend change.
Another example appears on GBP/USD during the London session. After a 60-pip upward move, price pulls back about 25 pips while the indicator remains bullish. That pullback provides a lower-risk buying opportunity compared to chasing the initial breakout.
Applying the Indicator in Live Trading
A trend filter becomes more useful when paired with market structure rather than traded alone.
Suppose USD/JPY is making higher highs and higher lows on the 4-hour chart. The indicator remains bullish throughout the move. Instead of buying every green candle, traders can wait for price to retrace toward a support zone or a 20-period moving average before looking for bullish engulfing candles.
This approach reduces emotional trading because entries happen after planned pullbacks instead of random price spikes.
Another common setup involves breakouts.
Imagine EUR/AUD has traded inside a narrow range for several hours. Price finally breaks above resistance, and the Trend Filter Indicator confirms an uptrend. A trader waits for price to retest the breakout level before entering. The stop-loss sits around 20 to 30 pips below the retest area, while the first profit target aims for roughly 50 to 70 pips. That creates a risk-to-reward ratio close to 1:2.
The indicator can also help traders stay out of trouble.
When price moves sideways and the indicator keeps changing colors every few candles, the market is likely ranging. Many experienced traders simply skip these periods instead of forcing trades.
Trading forex carries substantial risk. No indicator guarantees profits. Every setup should include a predefined stop-loss and position size based on account risk.
Best Settings and Customization Tips
Default settings work well for many traders, but small adjustments can better match different trading styles.
Scalpers using the 5-minute or 15-minute chart often reduce the smoothing period to make the indicator respond faster. This produces earlier entries, although it may generate more false signals during quiet sessions.
Day traders on the 1-hour chart usually prefer medium settings that balance speed and reliability. Many find this timeframe offers cleaner trends while limiting unnecessary signal changes.
Swing traders frequently increase the calculation period on the 4-hour or daily chart. Longer settings react more slowly, but they filter out much of the short-term market noise.
Currency pair selection matters too.
EUR/USD and USD/CHF generally produce smoother trends than highly volatile pairs like GBP/JPY. Exotic currency pairs can trigger more false signals because of wider spreads and irregular price movement.
A helpful combination includes:
- Trend Filter Indicator for direction
- 200-period Moving Average for long-term bias
- RSI (14) to avoid buying after extended rallies
- Support and resistance levels for entry timing
Using several tools that measure different market conditions often produces better decisions than relying on multiple indicators that all measure the same thing.
Strengths, Weaknesses, and Comparison With Other Trend Tools
The biggest advantage of the Trend Filter Indicator MT4 is its ability to simplify decision-making. Traders quickly recognize whether buying or selling deserves more attention.
It also helps reduce countertrend trading, which is a common reason new traders lose money.
Still, the indicator has limitations.
Like every trend-following tool, it reacts after price has already started moving. That means entries sometimes occur after part of the trend has already developed. During ranging markets, repeated trend changes may create losing trades.
Compared with a standard Moving Average, the Trend Filter Indicator often responds faster while filtering more market noise. Against the Average Directional Index (ADX), it provides clearer directional signals, whereas ADX mainly measures trend strength rather than direction.
Some traders compare it with the Supertrend Indicator. Supertrend typically places stop levels directly on the chart, while many Trend Filter versions simply indicate bullish or bearish conditions without suggesting exit points.
The strongest results usually come from combining trend confirmation with price action instead of depending entirely on indicator signals.
Good trading decisions still require patience, discipline, and consistent risk management.
How to Trade with Trend Filter Indicator MT4
Buy Entry

- Confirm bullish trend – Enter only after the Trend Filter turns bullish on the 1-hour EUR/USD chart.
- Buy after a pullback – Wait for a 15-30 pip retracement before entering to improve risk-to-reward.
- Trade above key support – Buy only if price holds above a recent support level on the 4-hour chart.
- Wait for candle confirmation – Enter after a strong bullish candle closes above the trend line.
- Use a tight stop-loss – Place the stop 20-30 pips below the recent swing low.
- Target at least 1:2 RR – Risk 25 pips to aim for 50 pips or more.
- Check higher timeframe – Confirm the daily trend matches the buy signal before entering.
- Skip ranging markets – Don’t buy if the indicator changes direction several times in a short period.
Sell Entry

- Confirm bearish trend – Sell only after the Trend Filter turns bearish on the 1-hour GBP/USD chart.
- Sell after a retracement – Wait for a 15-30 pip pullback before opening the trade.
- Trade below resistance – Enter only when price rejects a resistance zone on the 4-hour chart.
- Wait for bearish confirmation – Sell after a strong bearish candle closes with the trend.
- Protect the trade – Place the stop-loss 20-30 pips above the latest swing high.
- Aim for 1:2 reward – Risk 30 pips to target 60 pips or more.
- Confirm with daily trend – Take sell trades only when the daily trend is also bearish.
- Avoid high-impact news – Don’t enter during NFP or major central bank announcements due to volatility.
The Trend Filter Indicator MT4 can become a valuable addition to a trading strategy when used correctly. It helps traders identify the dominant trend, avoid many low-quality trades during sideways markets, improve entry timing with pullbacks or breakouts, and maintain a structured trading routine. At the same time, traders should remember that delayed signals and ranging conditions remain its biggest weaknesses. No technical indicator predicts every market move. Testing the indicator on a demo account across different currency pairs and timeframes before risking real money is a practical next step. Over time, traders can determine whether the Trend Filter Indicator MT4 fits their own trading style and risk tolerance.
Recommended MT4/MT5 Broker
XM Broker
- *FREE $50 To Start Trading Instantly! (Withdraw-able Profit)
- Deposit Bonus up to $5,000
- Unlimited Loyalty Program
- Award Winning Forex Broker
- Additional Exclusive Bonuses Throughout The Year

>> Sign Up for XM Broker Account here <<


