

")


USDCAD trades above 100/200 hour MA
The USDCAD
USD/CAD
The USD/CAD is the currency pair encompassing the dollar of the United States of America (symbol $, code USD), and the Canadian dollar of Canada (symbol $ code CAD). The pair’s exchange rate indicates how many Canadian dollars are needed in order to purchase one US dollar. For example, when the USD/CAD is trading at 1.3500, it means 1 US dollar is equivalent to 1.35 Canadian dollars. The US dollar (USD) is the world’s most traded currency, whilst the Canadian dollar (CAD) is the world’s seventh
The USD/CAD is the currency pair encompassing the dollar of the United States of America (symbol $, code USD), and the Canadian dollar of Canada (symbol $ code CAD). The pair’s exchange rate indicates how many Canadian dollars are needed in order to purchase one US dollar. For example, when the USD/CAD is trading at 1.3500, it means 1 US dollar is equivalent to 1.35 Canadian dollars. The US dollar (USD) is the world’s most traded currency, whilst the Canadian dollar (CAD) is the world’s seventh
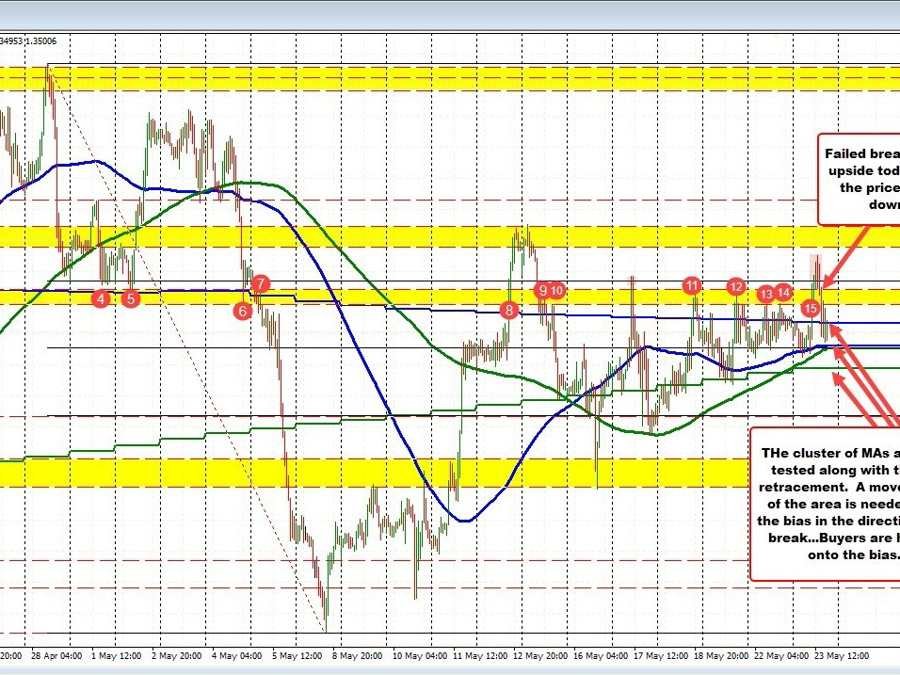
Read this Term pair has been fluctuating and is moving back towards its daily low, inching closer to a critical confluence of support defined by several key metrics: a 100-hour moving average
Moving average
A moving average is a statistical tool that is used to smooth out short-term fluctuations in data and reveal longer-term trends. It is calculated by taking the average of a certain number of data points over a specific period of time, and then plotting that average as a line on a chart. The most common types of moving averages are simple moving averages (SMA) and exponential moving averages (EMA).In financial markets, moving averages are often used to analyze stock prices, exchange rates, and ot
A moving average is a statistical tool that is used to smooth out short-term fluctuations in data and reveal longer-term trends. It is calculated by taking the average of a certain number of data points over a specific period of time, and then plotting that average as a line on a chart. The most common types of moving averages are simple moving averages (SMA) and exponential moving averages (EMA).In financial markets, moving averages are often used to analyze stock prices, exchange rates, and ot
Read this Term of 1.34918, a 50% retracement of the range since April 28 high at 1.34905, and a 200-hour moving average at 1.34902. The pair reached a low of 1.3494 in the North American trading session but found buyer support, with the current trading position at 1.3505.
On the descent, the pair fell below the 100-day moving average at 1.35058. Should the pair rebound above this moving average, it could shift the short-term buying momentum upwards. However, if the support cluster around the 1.3490 level is broken, the next key target would be the 200-day moving average at 1.34775; breaching this level would intensify the bearish bias.
Currently, the pair is characterized by choppy price action, with all key moving averages and the 50% midpoint retracement level converging within a narrow 28-pip range. Although this volatility can be frustrating, the bright side is that this convergence zone can serve as a barometer for market sentiment—bullish if above, bearish if below. Furthermore, prices usually diverge from converged moving averages over time, hinting at a potential breakout. Traders can thus anticipate a significant price movement in the near future.


")

