


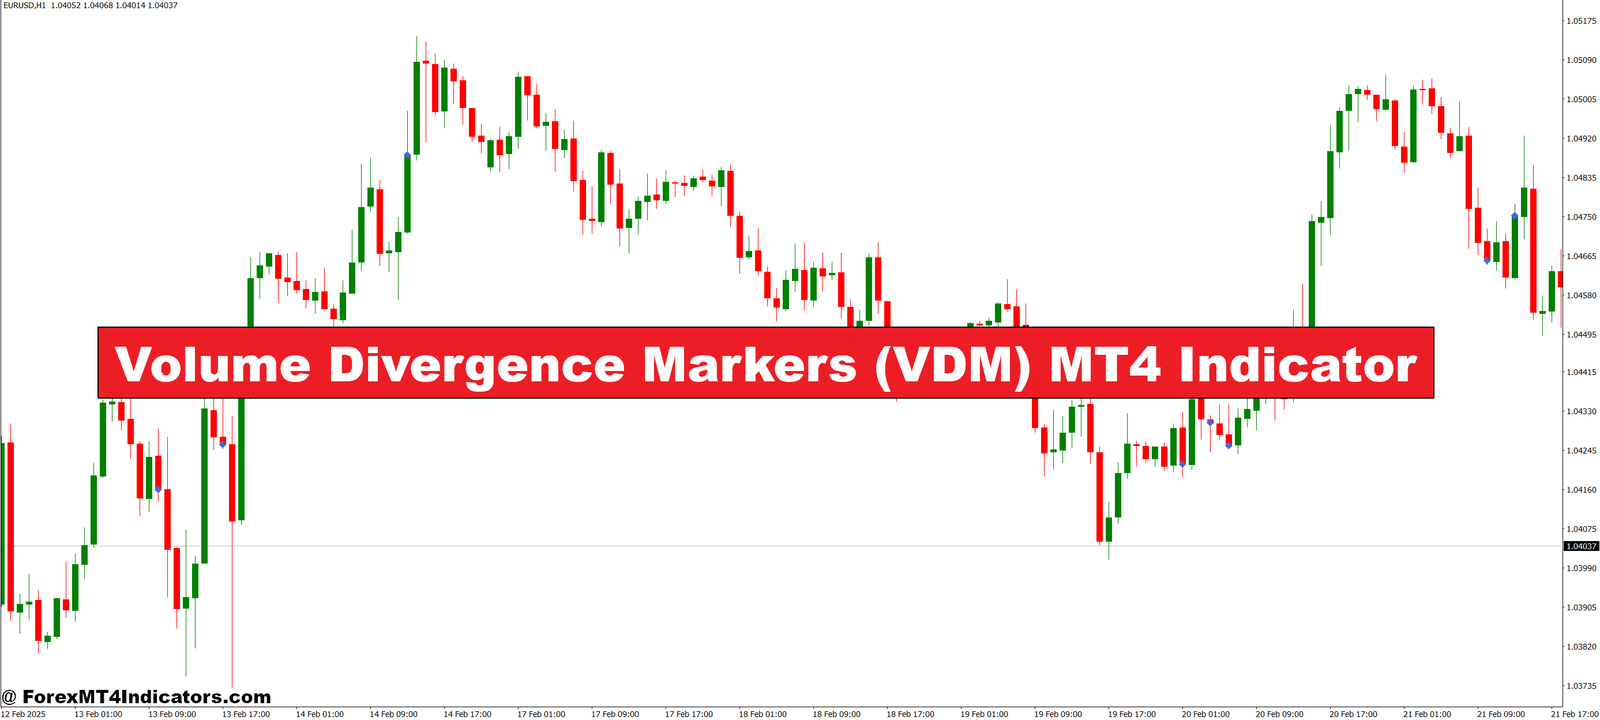
 MT4 Indicator")
The VDM MT4 Indicator is designed to reveal divergences between price action and volume activity. While price might be moving in one direction, volume tells another story. This hidden difference often signals a potential reversal or weakening trend. The VDM automatically detects and marks these divergences with visual cues directly on your chart, eliminating the need for manual analysis.
It works by comparing price highs and lows against volume peaks. When there’s a mismatch—such as price making a new high but volume dropping—the indicator plots divergence markers. This helps traders spot early signs of exhaustion in buying or selling pressure.
Why VDM Matters in Real Trading
Many traders rely only on indicators like RSI or MACD for divergence. But without volume, they’re missing a critical piece of the puzzle. Volume shows the strength behind price movements. If volume drops while price rises, it often means the move isn’t supported—something VDM highlights instantly. These real-time markers help traders confirm breakouts, detect fakeouts, and make smarter entries.
Also, the indicator is user-friendly and doesn’t clutter the chart. Its clean signals are perfect for beginners and pros alike. Whether trading forex, commodities, or indices, VDM adapts to different strategies.
How Traders Use the VDM Indicator
 MT4 Indicator 1")
Traders can use the VDM MT4 Indicator as a confirmation tool or a standalone signal provider. When the price hits a resistance level and VDM shows a bearish divergence, it can suggest a short setup. On the flip side, a bullish divergence near support can signal a buying opportunity.
It’s best used on higher timeframes for strong signals, but also works well intraday. Combining it with price action or trend lines improves accuracy. By showing where price and volume disagree, VDM empowers traders to act with confidence.
How to Trade with Volume Divergence Markers (VDM) MT4 Indicator
Buy Entry
 MT4 Indicator 2")
- Price makes a lower low while volume makes a higher low (bullish divergence detected).
- A green bullish divergence marker appears below the price on the chart.
- Wait for a bullish candlestick pattern (e.g., bullish engulfing or hammer) to confirm the entry.
- Entry can be taken on the next candle after confirmation.
- Place a stop-loss just below the recent swing low.
- Target previous resistance or use a risk-reward ratio of 1:2 or better.
Sell Entry
 MT4 Indicator 3")
- Price makes a higher high while volume makes a lower high (bearish divergence detected).
- A red bearish divergence marker appears above the price on the chart.
- Wait for a bearish candlestick pattern (e.g., bearish engulfing or shooting star) to confirm the entry.
- Enter short on the next candle after confirmation.
- Place a stop-loss just above the recent swing high.
- Target the next support level or aim for a 1:2 risk-reward ratio.
Conclusion
The Volume Divergence Markers (VDM) MT4 Indicator offers a simple yet powerful way to spot divergence between volume and price. It helps traders find high-probability setups and avoid traps caused by weak price moves. Easy to use and visually clear, VDM is a valuable addition to any trading strategy. Whether you’re trying to improve your entries or reduce false signals, this tool can give you the edge you’ve been missing.
Recommended MT4/MT5 Broker
XM Broker
- Free $50 To Start Trading Instantly! (Withdraw-able Profit)
- Deposit Bonus up to $5,000
- Unlimited Loyalty Program
- Award Winning Forex Broker
- Additional Exclusive Bonuses Throughout The Year
- Exclusive 90% VIP Cash Rebates for all Trades!
 MT4 Indicator 4")

Already an XM client but missing out on cashback? Open New Real Account and Enter this Partner Code: VIP90


