


The Vstop indicator offers a solution rooted in price volatility itself. Instead of guessing where to place stops, it calculates dynamic levels based on Average True Range (ATR), adjusting automatically as market conditions shift. When volatility spikes, your stops widen. When things calm down, they tighten. This approach keeps you in winning trades longer while still protecting capital.
Understanding the Vstop Indicator
The Vstop is a volatility-based trailing stop system that plots dynamic support and resistance levels on your chart. Unlike traditional moving averages, it doesn’t just follow price—it responds to how much the market is actually moving. Think of it as a smart trailing stop that breathes with the market.
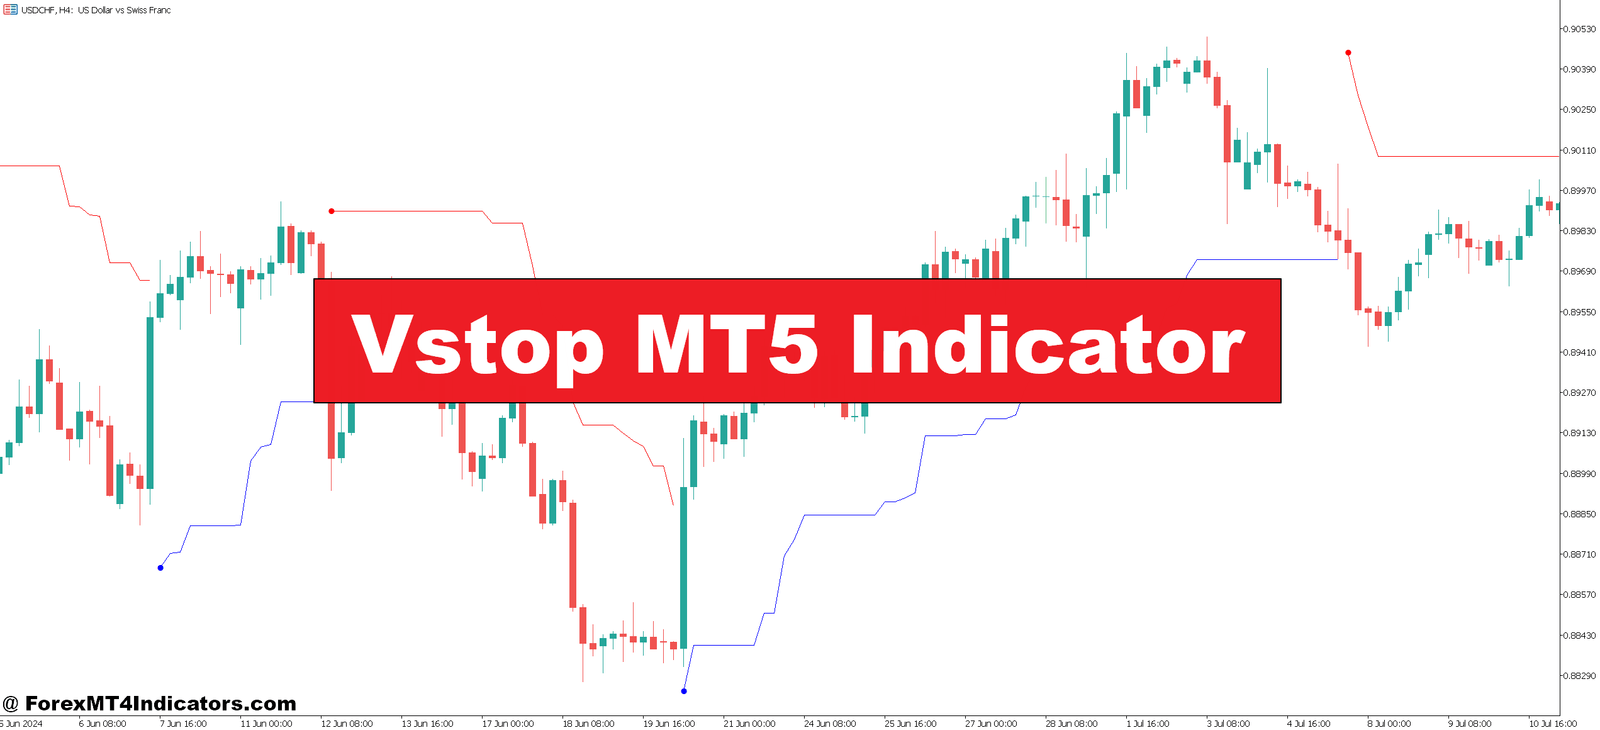
At its core, the indicator shows up as a line that switches between appearing above and below price action. When price is trending up, the Vstop plots below as a rising support level. When the trend flips bearish, it jumps above price as resistance. This visual simplicity makes trade management straightforward: stay long while price holds above the line, exit when it breaks below.
What sets this tool apart from basic moving averages is its calculation method. The Vstop uses ATR—a measure of recent price ranges—multiplied by a factor you can adjust. This means the indicator naturally gives price more room during the London open when GBP pairs go wild, then tightens during the quieter New York afternoon sessions.
How the Vstop Calculation Works

The math behind Vstop isn’t complicated, but understanding it helps you use the tool effectively. The indicator calculates an offset distance from price highs or lows based on ATR values. Specifically, it takes the ATR over your chosen period (commonly 14) and multiplies it by a factor (typically 2.0 to 3.0).
For uptrends, the formula looks something like this: Vstop level = Highest High – (ATR × Multiplier). The indicator then trails this level upward, but it never moves down—that’s the “stop” part. It only rises or stays flat as new highs form. This creates that stair-step pattern you see on charts.
When price finally closes below this level, the indicator flips. It now calculates from the lowest low: Vstop level = Lowest Low + (ATR × Multiplier). The line jumps above price and starts trailing downward through any bearish move. This flip signals the potential trend change.
Here’s what this means in practice: If EUR/USD has an ATR of 60 pips on the 4-hour chart, and you’re using a 2.5 multiplier, your Vstop sits roughly 150 pips from the recent swing points. But that distance shrinks to maybe 100 pips when volatility drops during summer months.
Trading with the Vstop: Real Scenarios
Let’s get specific about how traders actually use this indicator. The most straightforward application is trend following with automatic exit signals. Say you spot a breakout on USD/JPY above a consolidation zone on the daily chart. You enter long, and instead of placing a fixed 80-pip stop, you use the Vstop line as your trailing stop reference.
Over the next five days, price climbs from 148.50 to 151.20. Your Vstop level rises from an initial 147.90 to 149.80, locking in nearly 130 pips of profit. Then comes a sharp reversal—maybe driven by BOJ intervention rumors. Price plunges and closes at 149.60, below your Vstop. You exit with a solid gain instead of watching the full move evaporate.
That scenario plays out differently with fixed stops. A 100-pip fixed stop might have gotten you out too early during a routine pullback at 149.50 on day three. Or a 200-pip stop would’ve given back more profit when the reversal hit. The Vstop adapts—it gave you the breathing room when the trend was healthy but got you out when character changed.
Another practical setup involves combining the Vstop with support and resistance zones. When testing this on GBP/USD during the September 2024 Bank of England decision, the pair was grinding along the 1.3150 resistance level. The Vstop flipped bearish right as price rejected that resistance for the third time, confirming the short opportunity. The subsequent 200-pip drop over two days became a cleaner trade because both the level and the indicator aligned.
Customizing Vstop Settings for Different Markets

The default settings—14-period ATR with a 2.5 multiplier—work okay on major pairs on the 4-hour and daily timeframes. But you’ll want to adjust based on what you’re trading and your style. Scalpers using the 5-minute chart typically need to bump the multiplier up to 3.5 or even 4.0 to avoid getting stopped out by normal noise.
For swing trading on daily charts, some traders prefer a longer ATR period like 20 or 21, reasoning that a broader volatility sample produces more stable stop levels. That makes sense if you’re holding EUR/CHF for a week or two and don’t want to get shaken out by one random 80-pip spike.
Currency pairs matter too. AUD/JPY and GBP/JPY—the wild children of forex—often need higher multipliers than EUR/USD or USD/CHF. During Asian session trading, I’ve seen the Vstop on GBP/JPY work better at 3.0× compared to the same timeframe on EUR/USD where 2.0× is plenty.
The color settings might seem trivial, but they’re not. Setting distinct colors for bullish (green or blue line below price) and bearish (red line above) helps you scan multiple charts quickly. When you’re monitoring six pairs during London open, that visual clarity speeds up decision-making.
Strengths and Weaknesses: The Honest Assessment

The Vstop shines in trending conditions. When EUR/USD trends for three weeks straight—like it did in October 2024 during the dollar rally—this indicator keeps you positioned correctly. It prevents premature exits from normal pullbacks while still protecting you from major reversals. You’re essentially automating part of the “let your winners run” principle.
It also reduces the emotional component of stop placement. You’re not staring at your position, wondering if you should tighten your stop or give it more room. The indicator makes that decision based on actual volatility data, not fear or greed. That’s valuable during overnight gaps or when you can’t watch the charts.
But here’s the thing: The Vstop struggles in choppy, range-bound markets. Those sideways grinds where EUR/GBP bounces between 0.8300 and 0.8400 for a month will wreck you. The indicator flips back and forth, generating false signals and whipsaw losses. You’ll enter long, get stopped out, enter short, get stopped out again—classic chop.
Another limitation shows up during sudden news events. The ATR-based calculation reflects past volatility, not future shocks. If the Fed surprises markets with a 50-point hike when everyone expected 25, price might gap past your Vstop level before you can react. Your “dynamic” stop becomes just another missed exit.
The indicator also lags more than traders expect. Because it uses an ATR period of 14 or more bars, it takes time to adjust to new volatility regimes. When the market shifts from quiet summer trading to volatile autumn action, the Vstop might keep stops too tight for a few days until the ATR catches up.
Making the Vstop Work in Your System
Most experienced traders don’t use the Vstop in isolation. Combining it with other trend filters improves results significantly. For instance, pairing it with a 200-period moving average helps you avoid those choppy markets—only take Vstop signals when price is clearly above or below that MA.
Support and resistance confluence matters too. A Vstop bearish flip at random price levels is less reliable than one that happens right at a major resistance zone. When the indicator confirms what the chart structure is already telling you, the probability tilts in your favor.
Position sizing integrates naturally with this approach. Since the Vstop gives you a specific exit point, you can calculate your risk in pips and adjust lot size accordingly. If your Vstop on USD/CAD sits 120 pips below your entry, and you’re risking 1% per trade, the math for position sizing becomes straightforward.
Risk management extends beyond just the stop level. Even with the Vstop, you should use proper position sizing and never risk more than 1-2% per trade. No indicator changes the fundamental rule that forex carries substantial risk, and most retail traders lose money. The Vstop is a tool, not a guarantee.
How to Trade with Vstop MT5 Indicator
Buy Entry

- Vstop flips below price – Enter long when the indicator line jumps from above to below price action and closes there on the 4-hour chart, signaling trend reversal from bearish to bullish.
- Price bounces off Vstop support – Take long positions when EUR/USD tests the Vstop line (acting as dynamic support) and rebounds with a bullish candle, confirming the uptrend remains intact.
- Vstop slope turns upward – Enter buy when the indicator line starts rising at a steeper angle on daily charts, indicating increasing bullish momentum and tightening stops as trend strengthens.
- Combine with major support – Go long only when Vstop bullish flip occurs at key support zones like 1.0800 on EUR/USD, adding confluence to your entry signal.
- Wait for volatility confirmation – Don’t enter immediately after the flip; wait 1-2 candles to confirm ATR isn’t spiking abnormally, which could signal false breakout conditions.
- Risk 1-2% maximum – Place your stop 10-20 pips below the Vstop line and size positions so total risk doesn’t exceed 2% of account, regardless of how strong the signal appears.
- Avoid during major news – Skip Vstop buy signals 30 minutes before and after high-impact events like NFP or FOMC, as volatility spikes create unreliable signals and potential gaps.
- Check higher timeframe alignment – Only take 1-hour Vstop buy signals when the daily chart also shows bullish Vstop position, filtering out counter-trend noise trades.
Sell Entry

- Vstop flips above price – Enter short when the indicator line switches from below to above price and candle closes beneath it on 4-hour GBP/USD, confirming bearish trend shift.
- Price rejects Vstop resistance – Go short when price rallies up to touch the Vstop line from below and forms bearish rejection candle, using the indicator as dynamic resistance.
- Vstop slope angles downward – Take sell positions when the indicator line descends more steeply on daily timeframes, showing accelerating bearish pressure and tightening trailing stops.
- Align with resistance zones – Only short when Vstop bearish flip happens at major resistance like 1.3200 on GBP/USD, increasing probability of sustained downward move.
- Confirm with momentum – Wait for RSI below 50 or MACD bearish crossover alongside Vstop flip before entering shorts, filtering weak signals during uncertain conditions.
- Set stops above Vstop plus buffer – Place stop loss 15-25 pips above the Vstop line to account for minor whipsaws, especially on volatile pairs like GBP/JPY.
- Skip in ranging markets – Don’t take Vstop sell signals when price has been chopping sideways for 20+ bars, as the indicator generates false flips in consolidation.
- Avoid low liquidity sessions – Ignore Vstop bearish signals during Asian session on EUR/USD (thin volume creates erratic movements) and Sunday evening opens prone to gaps.
Final Thoughts on the Vstop Approach
The Vstop MT5 indicator brings a volatility-aware perspective to stop loss management. Instead of arbitrary pip counts, it grounds your exits in what the market is actually doing. For trend followers, that’s a meaningful upgrade—fewer premature stops during healthy trends, quicker exits when momentum fades. You stay in sync with market conditions rather than fighting against them.
That said, it’s not a magic solution for every scenario. Ranging markets still present challenges, and sudden news can override any technical indicator. The key is understanding when this tool adds value (strong trends on major pairs) and when to step aside (choppy conditions or extreme news events). Test it on different pairs and timeframes with a demo account before committing real capital.
Your next step is straightforward: Add the Vstop to your MT5 platform, backtest it on your preferred pairs, and note how it would’ve changed your historical trades. Pay attention to how often it kept you in good moves versus how many whipsaws it generated. That data tells you whether this approach fits your trading style and the markets you focus on.
Recommended MT4/MT5 Broker
XM Broker
- Free $50 To Start Trading Instantly! (Withdraw-able Profit)
- Deposit Bonus up to $5,000
- Unlimited Loyalty Program
- Award Winning Forex Broker
- Additional Exclusive Bonuses Throughout The Year
- Exclusive 90% VIP Cash Rebates for all Trades!


Already an XM client but missing out on cashback? Open New Real Account and Enter this Partner Code: VIP90


