


Australia’s February CPI landed net soft, prompting traders to lean net bearish, and AUD eventually breaking down and closing the week as the worst-performing major currency pair in the G10. Here’s how we chose AUD/USD post event and the strategy scenarios to study, and what it teaches us about trading around a known catalyst in a volatile macro environment.
Watchlists are price outlook & strategy discussions supported by both fundamental & technical analysis, a crucial step towards creating a high-quality discretionary trade idea before working on a risk & trade management plan.
If you’d like to follow our “Watchlist” picks right when they are published throughout the week, check out our BabyPips Premium subscribe page to learn more!
The Setup
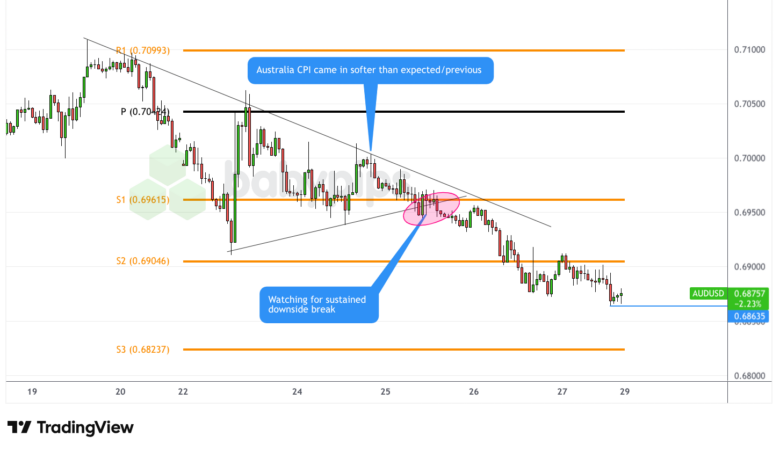
Following the Australia CPI Event Guide and a pair of pre-event watchlist articles, our case study identified AUD/USD as the best possible pair to move on from the Watchlist stage, based on the information post Australia CPI event. Heading into Wednesday’s release, the pair was compressing inside a symmetrical triangle just below the .7000 psychological level, with the 100 SMA (blue) and 200 SMA (pink) both sloping downward above price — creating a layered ceiling of dynamic resistance. The directional bias was bearish at medium conviction (3/5), acknowledging that the RBA’s still-hawkish stance and geopolitical headline risk could limit or reverse any move.
Two strategies were outlined in the case study for educational purposes:
- Scenario A (Aggressive): Short on a confirmed break below S1 (.6962), stop above .7045, targets at S2 (.6905) and S3 (.6824)
- Scenario B (Conservative): Wait for a bounce back toward .7000 and look for rejection there before entering short, stop above .7045, same targets
Event Outcome
Australia’s Bureau of Statistics reported February CPI on March 25 at 12:30 am GMT. The key metrics were lower than expectations & previous reads:
| Metric | Expected | Actual | Previous |
|---|---|---|---|
| Headline CPI y/y | 3.8% | 3.7% | 3.8% |
| Headline CPI m/m | 0.1% | 0.0% | 0.4% |
| Trimmed mean CPI y/y | 3.4% | 3.3% | 3.4% |
| Trimmed mean CPI m/m | 0.3% | 0.2% | 0.3% |
The miss was clean and consistent — not just headline softness driven by a one-off category. The trimmed mean, which is the RBA’s preferred underlying gauge, came in below both the prior reading and consensus, which was the more market-moving detail. AUD/USD dropped sharply on the release, breaking below S1 (.6962) and finishing the session down on the day.
Promotion: Top-tier catalysts like the Australian CPI report can trigger emotional execution. TradeZella AI powered journal turns your raw data into a high-performance playbook. Sync your broker, replay your trades bar-by-bar, and use the Playbook Designer to ensure that next time a central bank surprises the market, you’re executing with clinical precision.
Click on the link to learn more and use code “PIPS20” to save 20% off first purchase!
Disclosure: We may earn a commission from our partners if you sign up through our links, at no extra cost to you.
Broad Market and Exogenous Drivers:
Last week’s macro backdrop amplified the bearish AUD setup rather than disrupting it. Tuesday’s flash PMI data — released before the CPI — showed Australia’s services sector collapsing to 46.6 against a forecast of 54.7, a historic miss that cast doubt over RBA flexibility and pre-loaded bearish AUD sentiment heading into Wednesday. This was arguably the week’s most underappreciated AUD driver, arriving before the event and reinforcing the downside case before the CPI data even printed.
Geopolitically, the US-Iran conflict continued to dominate. Markets spent the week swinging between brief ceasefire optimism (Trump’s five-day pause, then ten-day extension) and renewed escalation (Iranian missiles targeting Gulf states, naval mines in the Strait of Hormuz, US troop deployments). For AUD specifically, risk-off flows and a firm USD — supported by strong US PMI data and rising Treasury yields — kept a structural ceiling on any recovery attempts. AUD finished the week as the worst-performing G10 currency, down 2.16% against the USD.
Fundamental Bias Triggered: With CPI landing in slightly below expectations & previous reads, we leaned net bearish on AUD, and with developments in the Middle East conflict pointing less to resolution and more towards escalation, AUD/USD seemed like the pair to focus on moving beyond the watchlist stage.
AUD/USD: Bearish AUD Event Outcome + Risk-Off Scenario = Arguably good odds of a net positive outcome
AUD/USD 1-hour Forex Chart Faster with TradingView
Scenario A — Aggressive Short: Supported a Positive Outcome
The aggressive approach in our Case Study called for a short entry on a confirmed break and/or retest of S1 (.6962), with a stop above .7045 and targets at S2 (.6905) and S3 (.6824). Here’s how each element played out:
| Element | What we said | What happened | Result |
|---|---|---|---|
| Entry trigger | Break/retest of S1 (.6962) | S1 broke cleanly on CPI; brief consolidation near that level offered a retest window | ✓ Triggered |
| Stop (.7045) | Above 200 SMA and pivot | Price never approached .7045 after the breakdown; bearish momentum was sustained | ✓ Not hit |
| Target 1 — S2 (.6905) | First conservative exit | Price broke through S2 by Thursday and continued lower | ✓ Reached |
| Target 2 — S3 (.6824) | Partial move target | AUD/USD closed the week at .6876 not quite near S3 | ~ miss |
Traders who entered on the break or retest of S1 with the stop above .7045 had a relatively clean ride. Price moved in the anticipated direction without threatening the stop, S2 was cleared comfortably, but S3 was still far away at week’s end.
The one caveat worth noting: the wide stop above .7045 meant Scenario A carried nearly a full ATR of risk (~95 pips). That was a drawback of this approach, and it’s worth acknowledging even in a week where price never came close to the stop. Good outcomes don’t automatically validate wide risk — position sizing discipline is what makes that risk acceptable in the first place.
Promoted: The Industry’s Most Trusted Path to Trading Up to $200,000
Stop risking your own capital. FTMO (4.8-Star Trustpilot Rating from over 40,000 reviews) allows profitable traders to manage up to $200,000 of simulated capital, creating significant profit potential without personal financial risk. Traders consistently praise FTMO for its:
Fast, Reliable Payouts (often within 24 hours).
Fair Rules including the removal of time limits, reducing trading pressure.Learn more about FTMO & start a Free Trial Today!
Disclosure: We may earn a commission from our partners if you sign up through our links.
Not Eligible to Move Beyond Watchlist Stage
AUD/CHF and AUD/CAD — both lived in the “strong CPI” watchlist, so they share the same one-line dismissal reason: the fundamental trigger (hot print) simply didn’t fire. Their technical setups were never activated. Clean and simple.
EUR/AUD gets slightly more nuance because it’s the most interesting non-advanced pair of the group — the directional call (EUR/AUD higher toward 1.6700) was actually correct and the level was reached. The reason it didn’t advance is that due to rising odds that conflict in the Middle East will not find a resolution soon, our analysts felt AUD/USD was a better pair to move foward with given USD’s stronger “safe haven” status.
Case Study Scenario B — Conservative Bounce: Not Eligible to Move Beyond Watchlist
The Case Study’s conservative approach required a bounce back toward .7000 before triggering, which never came. After the CPI print, price broke S1 and moved lower in a near-continuous bearish sequence — no meaningful retracement materialized above .6970. Traders who waited for the bounce-and-reject entry were left on the sidelines as the move played out without them, which was the explicitly flagged risk in the original case study.
The Verdict
This week’s AUD/USD case study delivered an arguably net positive theoretical outcome, and it’s worth understanding why — and giving credit where it’s due across the workflow that produced it.
The Event Guide correctly framed the “in-line or slightly softer” scenario as the base case, flagged AUD/USD as a clean directional expression on the soft side, and correctly anticipated that downside for AUD might be limited — language that aged well given that the pair still found some support near S2/S3 and didn’t collapse entirely. The Event Guide also flagged the February print as the “last clean read” before oil shock distortions, which helped frame expectations appropriately. Overall: the Event Guide set up the right scenario with the right pair.
The case study identified a clear technical structure (symmetrical triangle, layered MA resistance, defined pivot levels) that gave traders concrete reference points for entries, stops, and targets. The bearish directional bias was correct. The medium conviction framing (3/5) was perhaps slightly conservative in hindsight — the technical setup was clean and the macro environment was firmly supportive — but given the Iran headline risk and the RBA’s still-elevated hawkish posture, the caution was defensible.
Where the case study arguably undersold the setup was in not giving more weight to the services PMI data released Tuesday — a week-defining miss for AUD that arrived before the CPI and compounded the bearish case. In markets where geopolitics dominate headlines, cross-checking the full event calendar mid-week (not just the primary catalyst) matters as much as the event analysis itself.
Overall Assessment
| Component | Rating | Notes |
|---|---|---|
| Event Guide scenario framing | Strong | Correct base case, correct pair, appropriate nuance on downside limits |
| Pair selection | Strong | AUD/USD was the clearest and most liquid expression of the soft CPI scenario |
| Technical structure | Strong | Triangle breakdown, MA confluence, and pivot levels all functioned as expected |
| Conviction calibration | Adequate | Medium (3/5) was defensible; arguably could have been higher given technical clarity |
| Scenario B (bounce entry) | Not activated | Bounce never materialized; correctly identified as a risk in the original article |
Overall, we’d rate last week’s articles and discussions surrounding the Australian CPI event as “highly likely” supportive of a net positive outcome, strongly due to the bearish momentum in AUD/USD after the case study discussion.
Key Takeaways:
The primary catalyst isn’t always the primary driver
Wednesday’s CPI print was the event we built the setup around — but Tuesday’s services PMI collapse arguably did as much work in establishing the week’s bearish AUD tone as the inflation data itself. In macro-driven markets, the full week’s data calendar often matters more than any single release. Checking in on mid-week data as it prints — and reassessing whether the setup’s core thesis still holds — is part of the analytical process, not an afterthought.
Scenario selection is a risk management decision, not just a style preference
Scenario A and Scenario B both pointed in the same direction, but only one got triggered. That’s not a failure of analysis — it’s the correct outcome. Scenario B required a specific condition (a bounce to resistance) that simply didn’t materialize. Designing entries around conditions rather than chasing price is what separates a framework from a guess. This week, the more aggressive entry — despite its wider stop — had the better risk-adjusted result because the setup was genuinely there.
Wide stops need wide targets to be worth the risk
Scenario A’s stop above .7045 was technically sound but required S3 to be reached to produce a meaningful R:R. This outcome is a good reminder that any trade with a stop wider than one ATR needs a correspondingly ambitious target to justify the risk — and traders need to plan for that before entering, not after price is moving.
Event Guides, Watchlist and Case Studies are all a part of our Premium Subscription. If you’d like to see these discussions right when they are published throughout the week, check out our BabyPips Premium subscribe page to learn more!
Promotion: Master the Discipline of Risk Management in Macro-Driven Markets
In this week’s AUD/USD case study, taking the aggressive short required accepting nearly a full ATR of risk, which amounted to approximately 95 pips. As the analysis noted, good outcomes do not automatically validate wide risk—position sizing discipline is what makes that risk acceptable in the first place
When geopolitical tensions and historic data misses collide, are you executing your trading plan with confidence, or letting fear dictate your stops? Unforeseen market reactions are where even the most well-defined technical setups can fail due to emotional execution. Furthermore, sitting on the sidelines when a conservative setup fails to trigger—like Scenario B in our study—requires immense patience and psychological control.
In “Positive Trading Psychology,” renowned psychologist Brett Steenbarger reveals in his newest book that the secret to navigating such volatility isn’t “fixing” your flaws—it’s doubling down on your innate character strengths. Learn how to stay clinical while the rest of the market is emotional, turning Monday’s “ticking time bomb” into your professional edge.
Learn more about “Positive Trading Psychology: Turning personal strengths into trading strengths” on Amazon!
Disclosure: We may earn a commission from our partners if you sign up through our links, at no extra cost to you.


