








Dogecoin (DOGE) retains a neutral-to-slightly bullish outlook at the time of writing on Monday. The largest meme coin hovers above $0.070, a critical support level that, if defended, could encourage bulls to increase exposure and raise the chances of a steady recovery.
Dogecoin poised to break monthly bearish streak
Dogecoin has posted a modest 0.9% return so far in August, signaling a potential end to its recent bearish trend. CryptoRank data shows DOGE returned -5.9% in May, -28.3% in June, and -3.4% in July. Notably, April remains the only month of significant outperformance this year, with average returns of 15.6%.
If the $0.070 support level holds, Dogecoin could see modest gains in August, potentially setting the tone for price action heading into year-end.
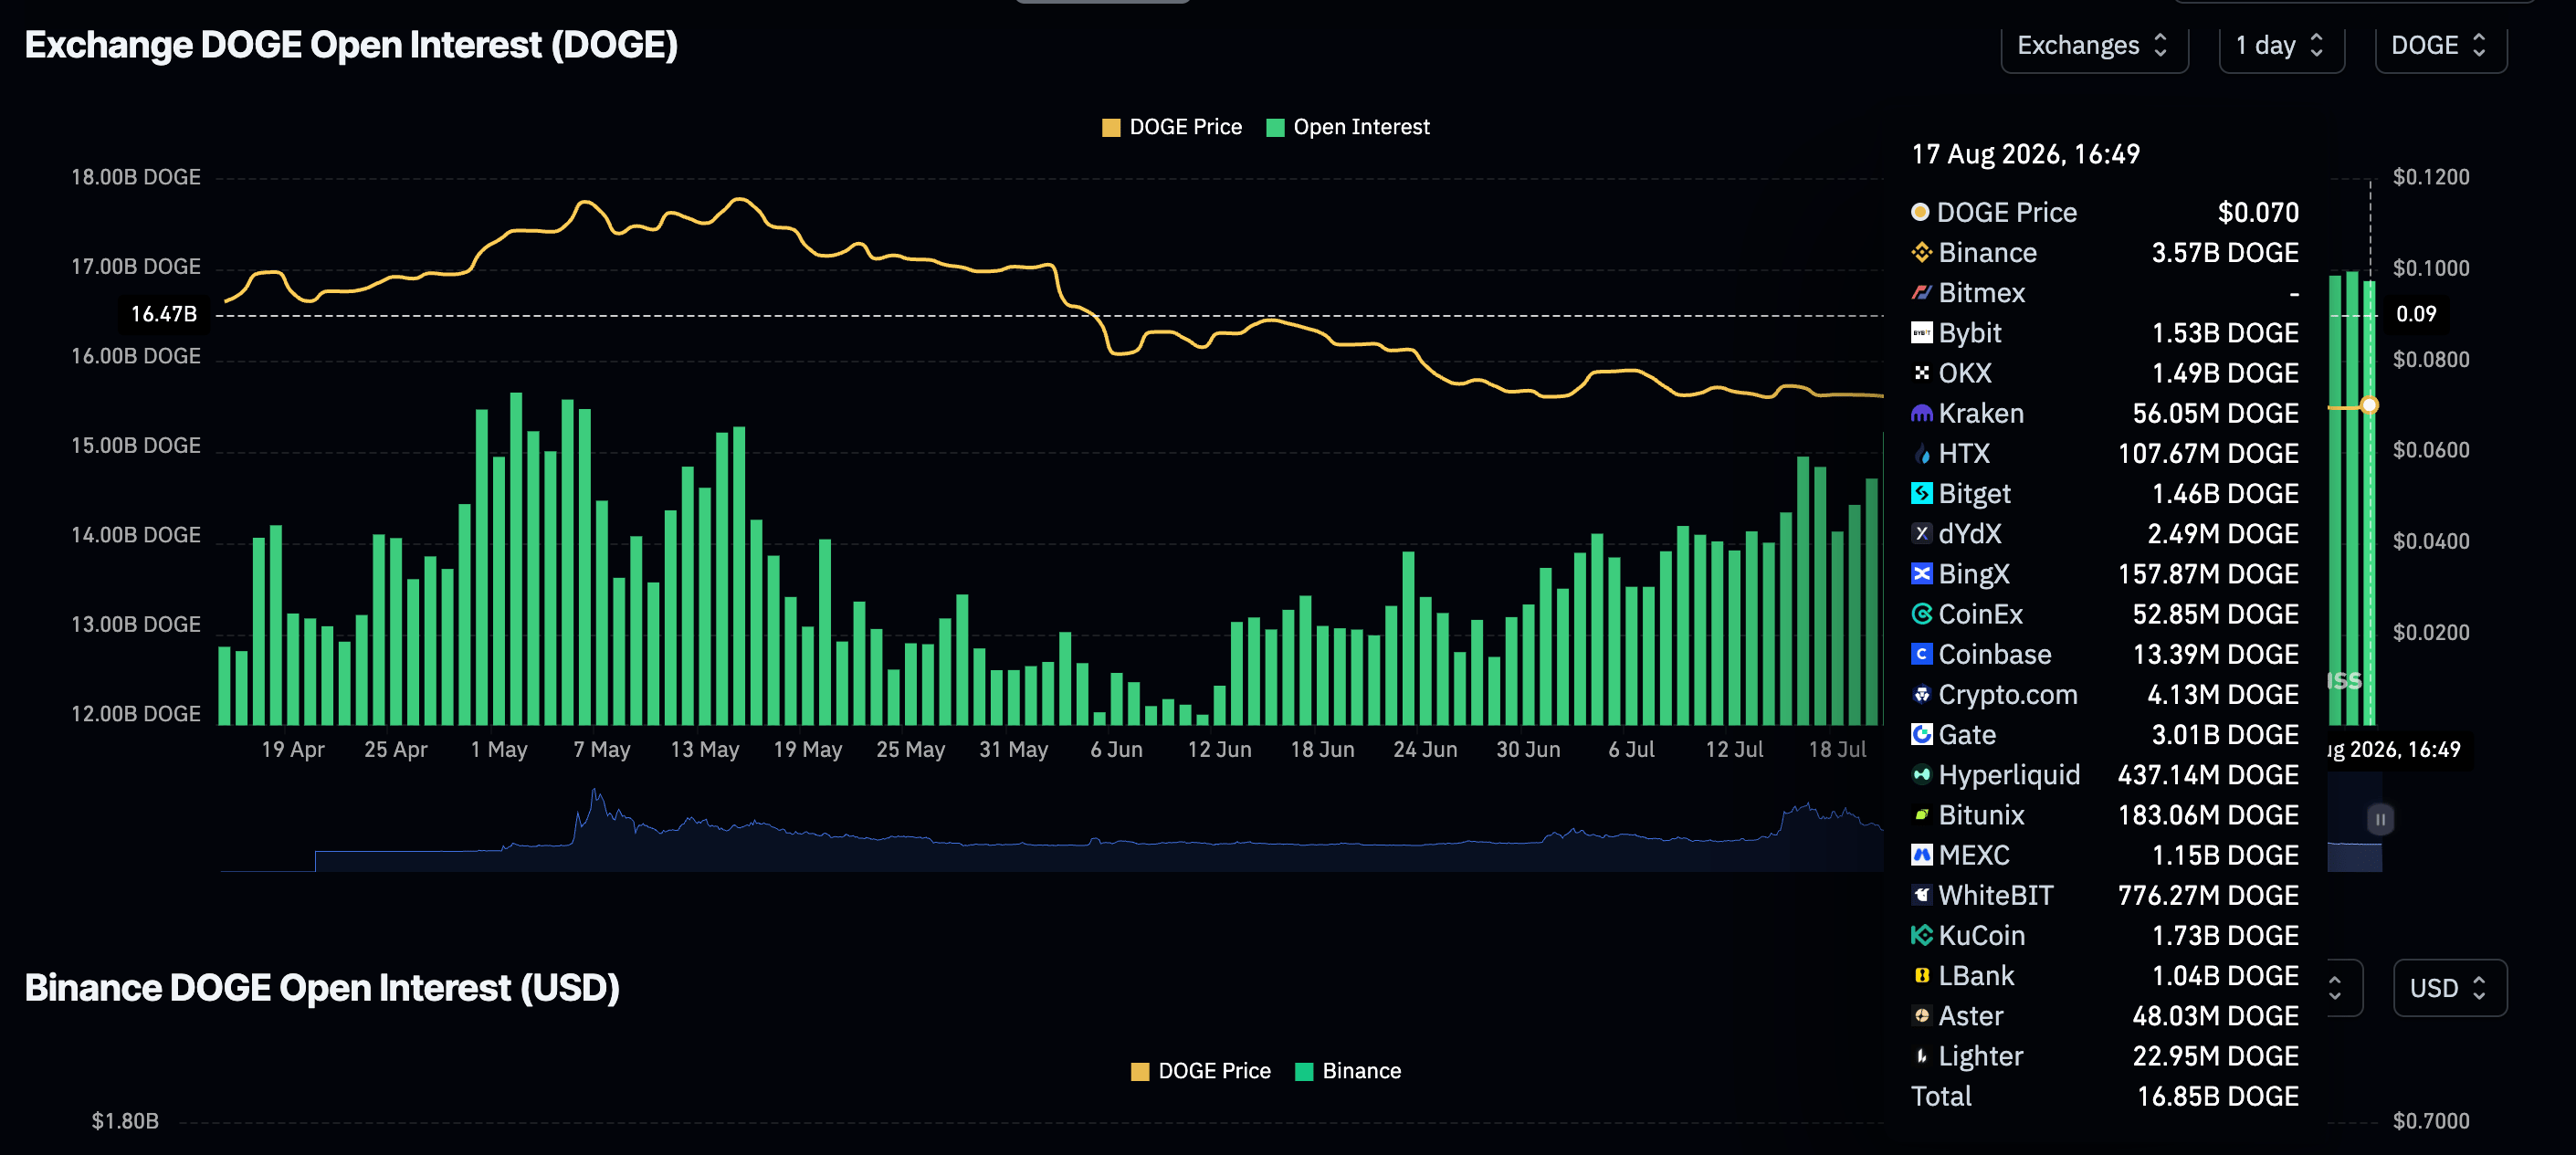
Meanwhile, the derivatives market remains relatively elevated, with perpetual futures Open Interest (OI) holding at 16.85 billion DOGE on Monday, down only marginally from 16.96 billion DOGE the previous day. Looking back, retail demand has grown steadily from 12.01 billion DOGE on June 11, underpinning growing investor interest in the token. Increases in OI often offset the selling pressure in the broader market, reducing the chances of extended losses while raising the odds of a sustained recovery.

Technical analysis: Dogecoin bulls eye short-term recovery
Dogecoin trades above $0.070, keeping a bearish near-term bias as price holds below a dense band of moving-average resistance. The 50-day Exponential Moving Average (EMA) at $0.074, the SuperTrend barrier at $0.075, and the 100-day EMA around $0.080 all sit overhead, reinforcing a capped tone, while the 200-day EMA near $0.095 underscores the broader downtrend.
The Relative Strength Index (RSI) at about 47 is edging higher but still below neutral on the daily chart, suggesting only modest recovery momentum that has yet to challenge the prevailing downside structure, with the Moving Average Convergence Divergence (MACD) hovering slightly positive but flattening, hinting at a lack of strong directional conviction.
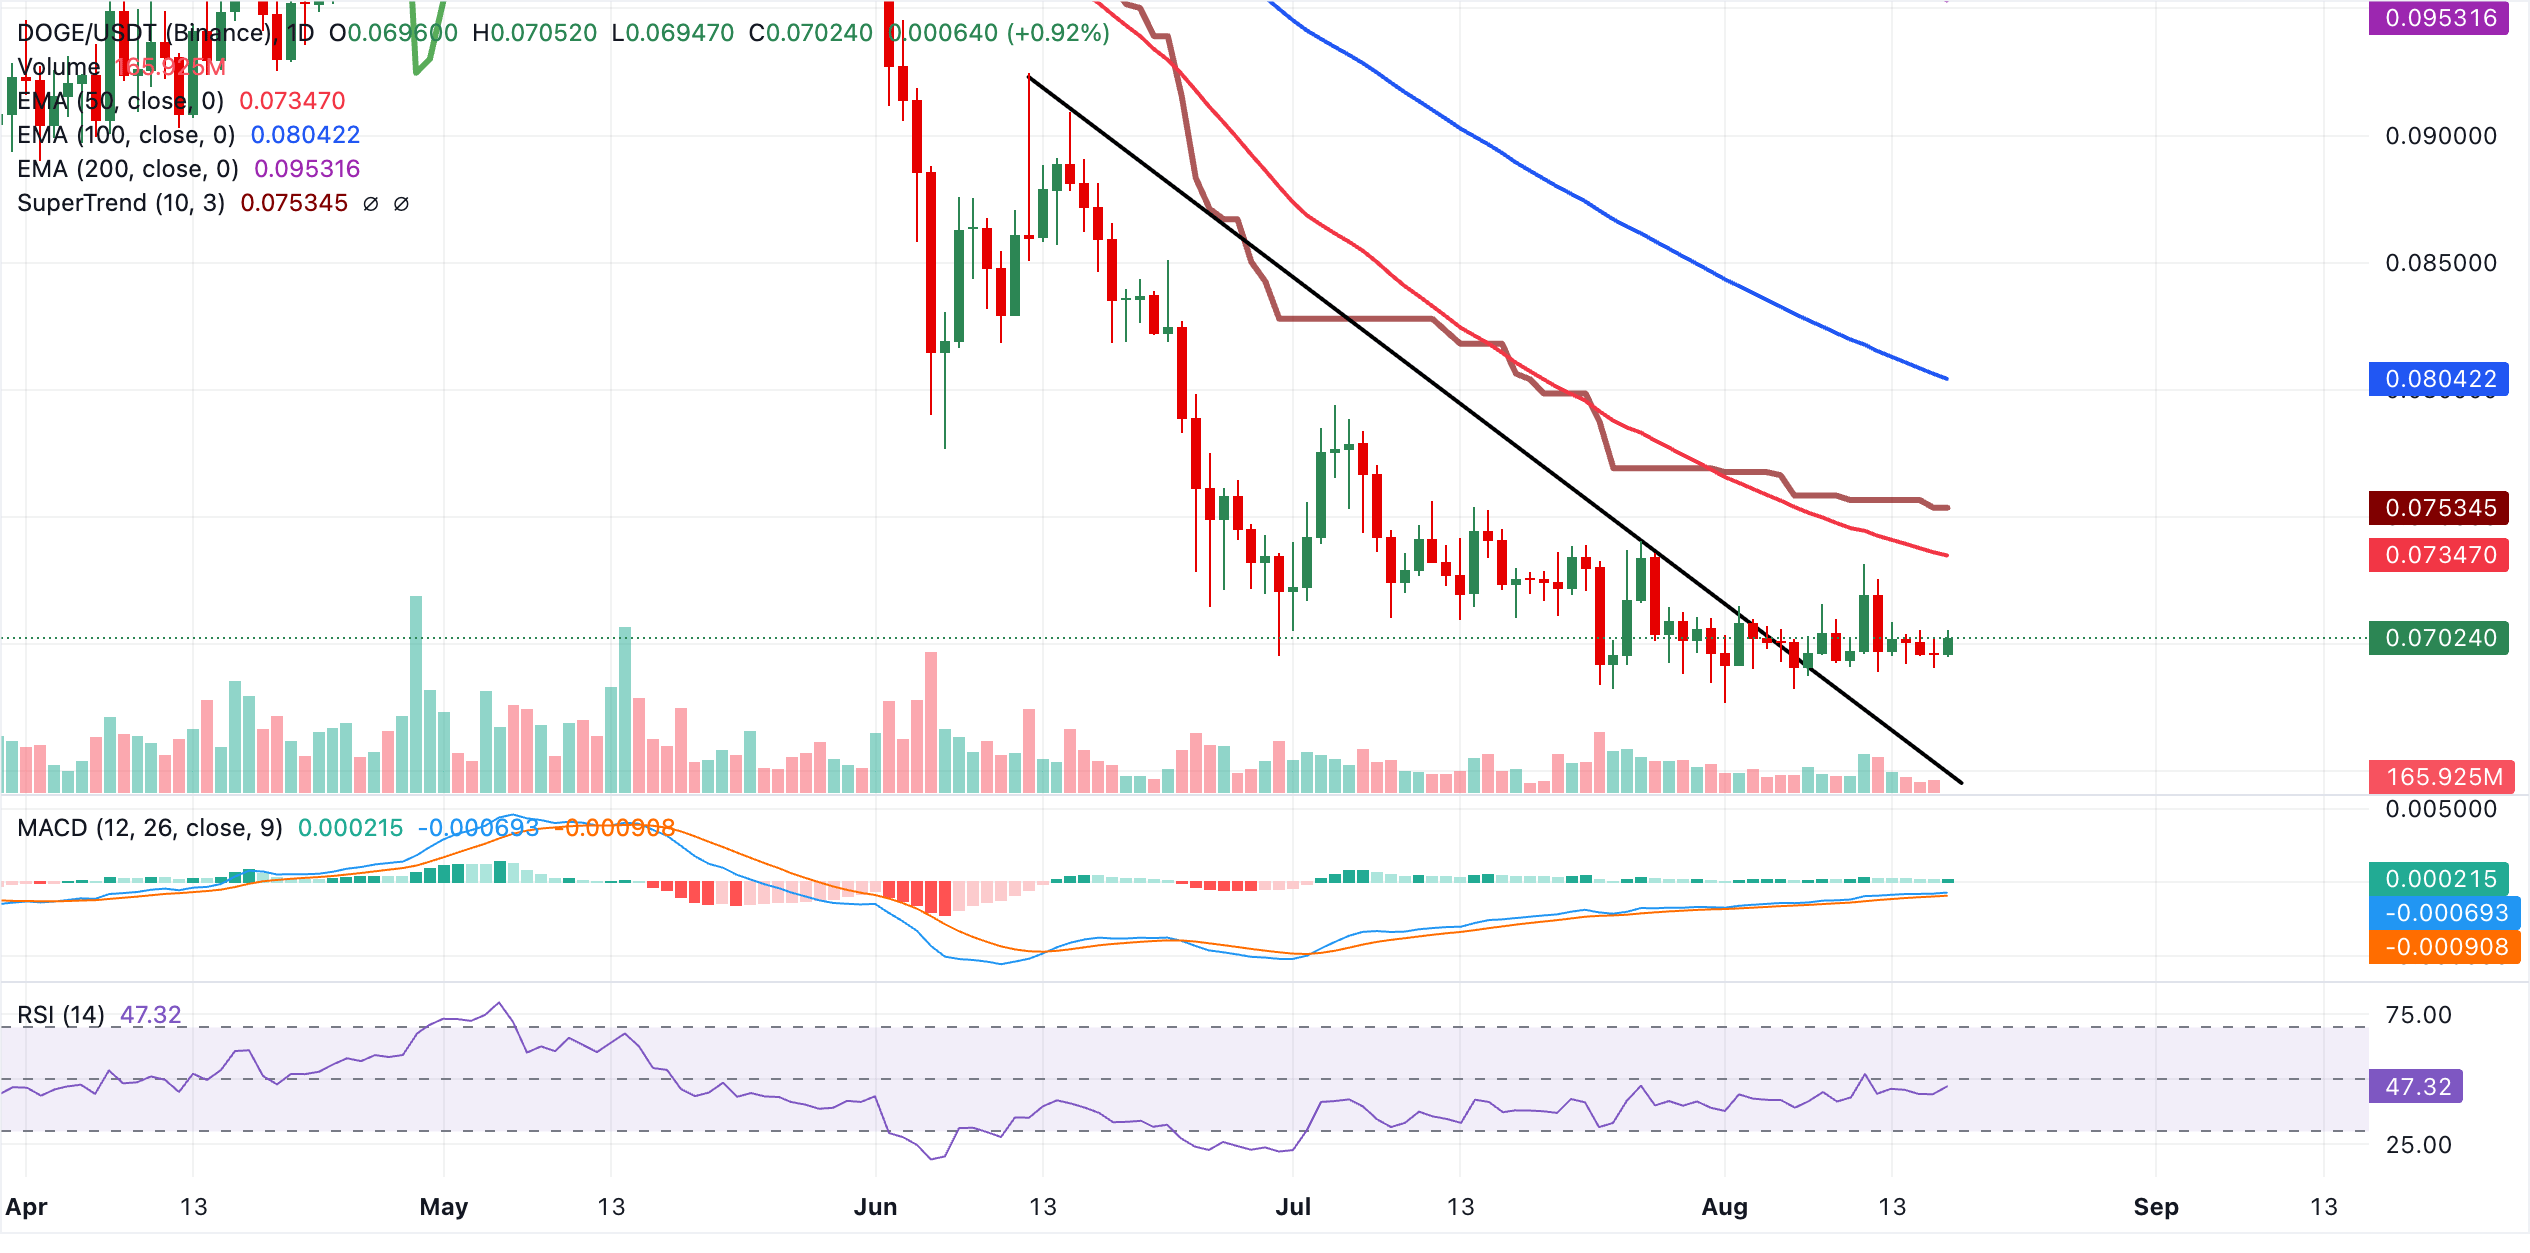
Initial resistance lies at the 50-day EMA around $0.074, with the SuperTrend line at $0.075 adding to this nearby supply zone. Above that, the 100-day EMA at $0.080 is the next level to watch, ahead of the more distant 200-day EMA up at $0.095, which defines the key hurdle for any larger trend reversal. On the downside, structural support lies near the prior trendline break area around $0.065. A daily close back toward that zone would reopen scope for further losses, while holding above it keeps open the possibility of a corrective bounce within the broader bearish framework.
(The technical analysis of this story was written with the help of an AI tool. Know more.)


