


WMT Elliott Wave technical analysis
Function: Trend.
Mode: Impulsive.
Structure: Motive.
Position: Wave v.
Direction: Upside in wave v.
Details: Assumption remains that wave iv has bottomed. However, due to the prolonged corrective action, there’s also a possibility that wave (ii) is still unfolding within wave iv as a flat correction.
Walmart Inc. (WMT) is currently showing signs of a possible shift into wave v on the daily timeframe, contingent upon confirmation that wave iv has ended. Despite the bullish assumption, the extended correction introduces an alternative count, suggesting the market might still be developing wave iv as a flat within wave (ii).
The structure remains constructive, but bullish confirmation is required before confirming the continuation of the upward trend.
Function: Counter Trend.
Mode: Corrective.
Structure: Flat.
Position: Wave c of (ii).
Direction: Bottoming in wave cDetails: Expecting continued downside toward wave c completion. Equality of wave c versus wave a projects a target at $92.
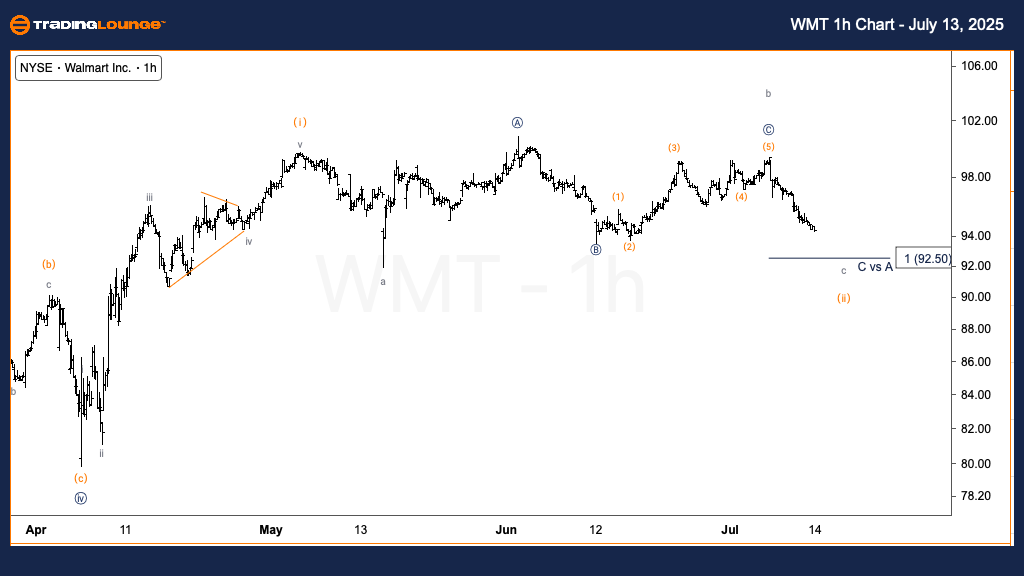
The 1-hour chart shows WMT likely finishing wave c of (ii) within a flat corrective pattern. The projected support level is around $92, aligning with wave c equaling wave a in length.
A bounce from $92 would indicate the correction is ending and wave v may soon begin. Until such movement occurs, traders should exercise caution, monitoring for signs of stabilization or reversal before entering new long positions.
WMT Elliott Wave technical analysis [Video]


