


")


The Yesterday High Low Indicator MT4 helps solve that problem by plotting the previous day’s highest and lowest prices directly on the chart. Instead of guessing where strong support or resistance might appear, traders can instantly see levels that many market participants are already watching. This creates a more structured trading approach, especially during London and New York sessions when volatility increases. The sections below explain how this indicator works, where it performs best, and how traders can use it as part of a disciplined trading strategy.
What Is the Yesterday High Low Indicator MT4?
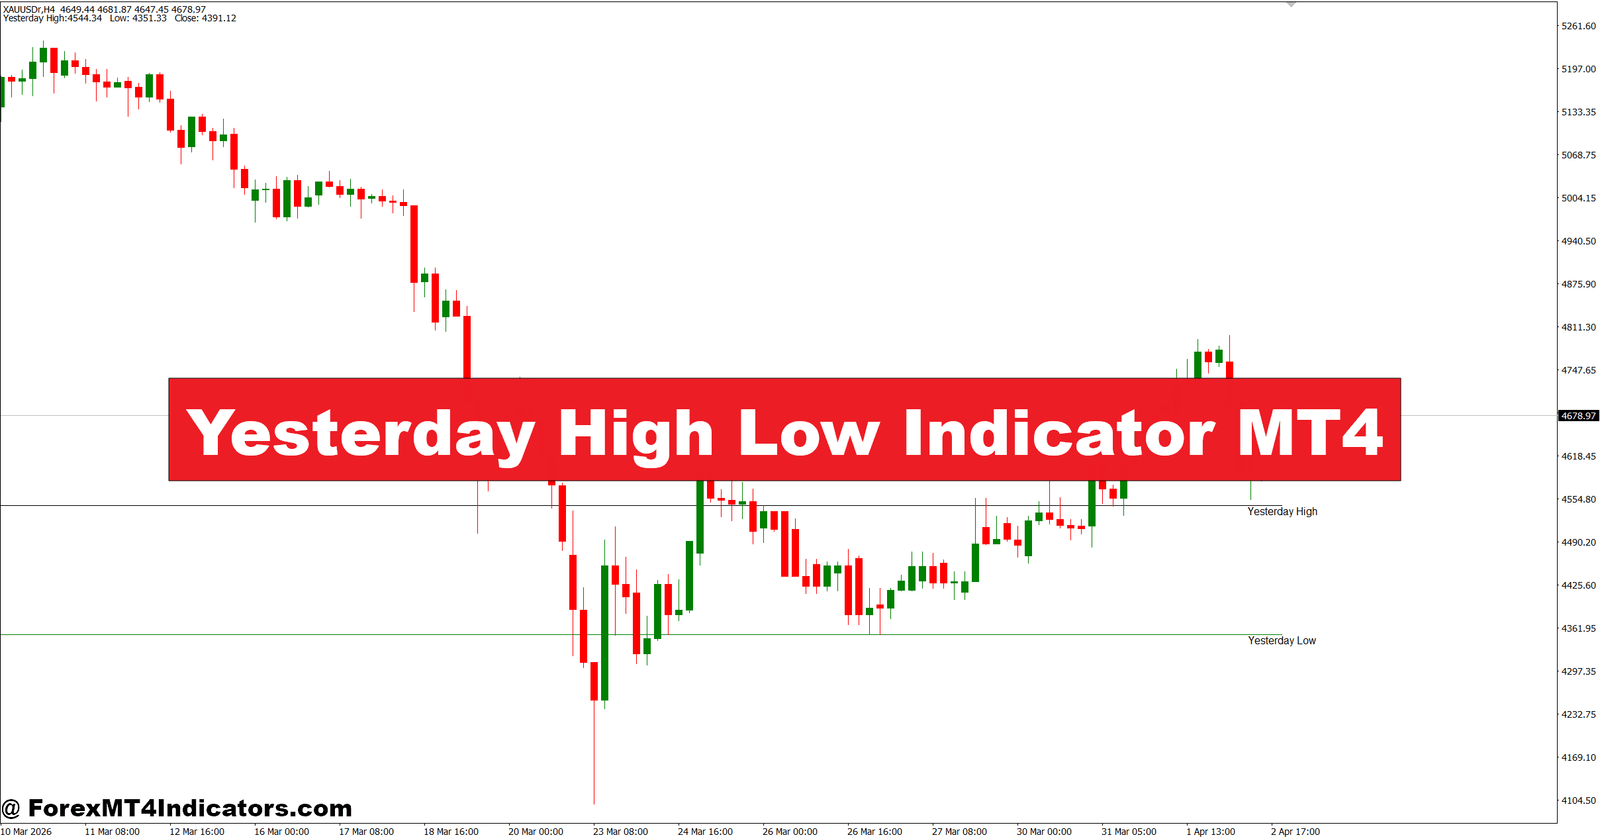
The Yesterday High Low Indicator MT4 is a technical analysis tool that automatically marks the previous trading day’s highest and lowest prices on a MetaTrader 4 chart. These horizontal levels remain visible throughout the current trading session, giving traders a simple reference for market structure.
Unlike moving averages or oscillators, this indicator doesn’t calculate momentum or trend strength. Instead, it highlights price levels that frequently act as support, resistance, breakout zones, or profit-taking areas.
Many institutional traders and day traders pay close attention to yesterday’s range because it often reflects where buyers and sellers previously reached an agreement. When price revisits those levels, reactions are common. Sometimes price bounces sharply. Other times it breaks through with strong momentum.
For example, if EUR/USD closed yesterday with a high at 1.1580 and a low at 1.1505, those exact levels become important reference points during today’s trading session.
How the Indicator Works
The logic behind this indicator is refreshingly simple.
After each trading day ends, the indicator scans historical price data and identifies:
- Yesterday’s highest price
- Yesterday’s lowest price
It then draws two horizontal lines across today’s chart.
That’s all it does, but those two levels often carry significant market value.
Many breakout traders wait for price to close above yesterday’s high before entering long positions. Others look for rejection candles around those same levels to trade reversals.
During testing on GBP/USD during several London sessions, price repeatedly respected yesterday’s high within a range of 5 to 12 pips before choosing a direction. While these reactions weren’t guaranteed, they appeared often enough to justify including the levels in a trading plan.
The indicator performs well because it reflects actual market behavior rather than mathematical smoothing.
Practical Trading Applications

The Yesterday High Low Indicator MT4 works in several trading styles.
Breakout Trading
One of the most common strategies is waiting for price to break yesterday’s high with strong momentum.
Imagine USD/JPY trading between 146.40 and yesterday’s high at 146.85. During the London open, a large bullish candle closes above 146.85 with increasing volume. Many traders treat this as confirmation that buyers have gained control.
A practical stop-loss might sit 15 to 20 pips below the breakout level, while the first profit target could equal 30 to 50 pips depending on current volatility.
Reversal Entries
Price doesn’t always continue after reaching yesterday’s levels.
Suppose AUD/USD reaches yesterday’s low during the New York session and forms a bullish engulfing candle. If other confirmation tools such as the Relative Strength Index (RSI) show oversold conditions, some traders may consider a long position expecting a bounce.
This approach often works better when the overall market remains inside a larger trading range instead of trending strongly.
Trend Confirmation
In an established uptrend, yesterday’s high often becomes fresh support after a successful breakout.
Traders sometimes wait for price to retest that level before entering rather than chasing the initial move. This helps reduce the chance of buying during a short-lived spike.
One practical lesson from live trading is avoiding breakouts during major news releases like the Non-Farm Payroll report. When testing this indicator on NFP days, price frequently moved above yesterday’s high before reversing within minutes. Waiting for a candle close instead of reacting immediately reduced several false entries.
Trading forex carries substantial risk. No indicator guarantees profits.
Best Settings and Customization
The default settings usually work well because the indicator simply identifies yesterday’s price range.
Still, many MT4 versions allow traders to customize several options.
Common adjustments include:
- Line color for high and low levels
- Line thickness for better visibility
- Display of previous weekly or monthly highs and lows
- Extension of lines across future candles
Most day traders use the indicator on:
- 15-minute charts
- 30-minute charts
- 1-hour charts
Scalpers often combine it with the 5-minute timeframe while keeping yesterday’s levels visible from the daily session.
Swing traders generally pair it with the 4-hour chart to see how daily levels align with larger market trends.
Currency pairs such as EUR/USD, GBP/USD, USD/JPY, and XAU/USD (Gold) often produce cleaner reactions because of their higher trading volume and liquidity.
Advantages, Limitations, and Comparison With Similar Indicators
One reason traders appreciate this indicator is its simplicity. It doesn’t clutter the chart with multiple calculations or changing signals. The levels remain fixed throughout the trading day, making planning much easier.
Another benefit is that it works alongside almost every trading system. Trend followers, breakout traders, and price action traders can all use yesterday’s high and low as additional confirmation.
Still, the indicator has limitations.
It doesn’t predict future direction. Price can easily break yesterday’s high, trigger buy orders, and then reverse sharply. During quiet Asian sessions, those levels may receive little attention until London opens.
Another limitation appears during strong trends. Price may ignore yesterday’s low or high entirely as momentum continues.
Compared with pivot point indicators, the Yesterday High Low Indicator MT4 focuses only on the previous day’s extreme prices instead of calculating multiple support and resistance levels.
Compared with Bollinger Bands, it doesn’t measure volatility.
Compared with moving averages, it doesn’t smooth historical prices or identify long-term trends.
Many experienced traders actually combine these tools. For example, if yesterday’s high aligns with the 200-period Exponential Moving Average and a Fibonacci retracement level, that area often attracts greater market attention than any single indicator alone.
The indicator should support price action analysis rather than replace it.
How to Trade with Yesterday High Low Indicator MT4
Buy Entry

- Wait for a breakout – Buy after a 1-hour candle closes 10-15 pips above yesterday’s high on EUR/USD.
- Trade the retest – Enter when price pulls back to yesterday’s high and forms a bullish candle.
- Confirm with volume – Take the trade only if the breakout comes with strong market momentum.
- Follow the trend – Buy only when the 4-hour trend is already bullish for higher-probability setups.
- Place a tight stop-loss – Keep the stop 15-25 pips below yesterday’s high to control risk.
- Target a 1:2 reward – Aim for at least 30-50 pips if risking around 20 pips.
- Avoid major news – Skip breakout trades during NFP or central bank announcements to avoid fake-outs.
- Use session timing – Focus on London or New York sessions when breakouts are more reliable.
Sell Entry

- Wait for a breakdown – Sell after a 1-hour candle closes 10-15 pips below yesterday’s low on GBP/USD.
- Sell the pullback – Enter after price retests yesterday’s low and prints a bearish rejection candle.
- Trade with the trend – Look for sells only when the 4-hour trend remains bearish.
- Set a protective stop – Place the stop-loss 15-25 pips above yesterday’s low.
- Aim for solid rewards – Target 30-60 pips while maintaining at least a 1:2 risk-to-reward ratio.
- Avoid sideways markets – Don’t sell if price has stayed inside yesterday’s range for several hours.
- Confirm with momentum – Use RSI below 50 or bearish MACD confirmation before entering.
- Manage open trades – Move the stop to breakeven after 20-25 pips of profit to protect gains.
Successful traders rarely depend on one signal alone, and the Yesterday High Low Indicator MT4 fits that mindset well. It offers a clear view of important market levels, helps identify breakout and reversal opportunities, and works effectively with other technical tools. At the same time, traders should remember that these levels can fail during strong trends or major news events. Using proper risk management, waiting for confirmation, and understanding the broader market context will improve decision-making. The Yesterday High Low Indicator MT4 becomes far more valuable when it’s treated as one piece of a complete trading plan instead of a standalone solution.
Recommended MT4/MT5 Broker
XM Broker
- *FREE $50 To Start Trading Instantly! (Withdraw-able Profit)
- Deposit Bonus up to $5,000
- Unlimited Loyalty Program
- Award Winning Forex Broker
- Additional Exclusive Bonuses Throughout The Year


>> Sign Up for XM Broker Account here <<


")
