

- The Mexican Peso gains further ground as the US Dollar selloff continues.
- Mexico’s Jobless Rate stays unchanged in November, US Jobless Claims climbed last week.
- Coming up on Friday: US Chicago PMI, Mexico Fiscal Balance.
The Mexican Peso (MXN) continued to climb through the penultimate trading day of 2023 before falling once more as broad-market US Dollar flows dictate the general direction of the FX market. A thin trading week between two market holidays is seeing some rough chop as speculators churn USD flows in thin market volumes to round out the 2023 trading year.
Despite a late topside break for the USD, the MXN is poised for a third straight week of gains against the US Dollar as the Greenback faces broad-market selling pressure.
Mexico’s unadjusted Jobless Rate held steady in November, thumbing its nose at market expectations of a minor decline, though the seasonally adjusted figure ticked higher. On the US side, Initial Jobless Claims and Pending Home Sales both missed expectations to come in worse than expected. With US data softening at the print, bad news is good news in topsy-turvy markets that are looking for accelerated rate cuts from the Federal Reserve (Fed).
Daily digest market movers: Mexican Peso hits fresh 16-week as Greenback continues to backslide
- The Mexican Peso is up around 0.3% against the US Dollar on Thursday, gaining 0.8% from the week’s opening bids.
- Broad-market USD selling pressure is bolstering the Peso, with the US Dollar the single worst-performing of the majors, in the red across the board for the last trading week of the year.
- Mexico’s unadjusted Jobless Rate held steady at 2.7% in November versus the forecast tickdown to 2.6%, though the seasonally-adjusted figure showed a slight jump to 2.8%.
- US Initial Jobless Claims jumped to 218K for the week ended December 22, vaulting over the forecast 210K and pushing even higher from the previous week’s 206K (revised upwards from 205K).
- US Pending Home Sales in November also failed to recover as much ground as forecasts expected, printing at a flat 0.0% compared to a forecast 1.0% gain; October’s print of -1.2% was revised slightly upwards from -1.5%.
- Friday will round out the 2023 trading year with the US Chicago Purchasing Managers’ Index for December, forecast to decline from 55.8 to 51.0.
- Mexico’s Fiscal Balance in Peso terms for November will wrap up the year’s economic data prints from Mexico. The Secretaría de Hacienda y Crédito Público, Mexico’s finance ministry, last printed a MXN 29.58 billion deficit in October.
US Dollar price this week
The table below shows the percentage change of US Dollar (USD) against listed major currencies this week. US Dollar was the strongest against the Pound Sterling.
| USD | EUR | GBP | CAD | AUD | JPY | NZD | CHF | |
| USD | -0.35% | -0.09% | -0.36% | -0.57% | -0.75% | -0.64% | -1.68% | |
| EUR | 0.43% | 0.27% | 0.11% | -0.15% | -0.39% | -0.21% | -1.25% | |
| GBP | 0.22% | -0.35% | 0.00% | -0.47% | -0.69% | -0.37% | -1.74% | |
| CAD | 0.36% | -0.30% | 0.21% | -0.47% | -0.40% | -0.12% | -1.47% | |
| AUD | 0.57% | 0.15% | 0.47% | 0.21% | -0.22% | -0.02% | -1.29% | |
| JPY | 0.75% | 0.43% | 0.48% | 0.68% | 0.21% | 0.31% | -1.09% | |
| NZD | 0.64% | 0.23% | 0.57% | 0.28% | 0.03% | -0.19% | -1.00% | |
| CHF | 1.84% | 1.21% | 1.40% | 1.46% | 1.33% | 1.07% | 1.06% |
The heat map shows percentage changes of major currencies against each other. The base currency is picked from the left column, while the quote currency is picked from the top row. For example, if you pick the Euro from the left column and move along the horizontal line to the Japanese Yen, the percentage change displayed in the box will represent EUR (base)/JPY (quote).
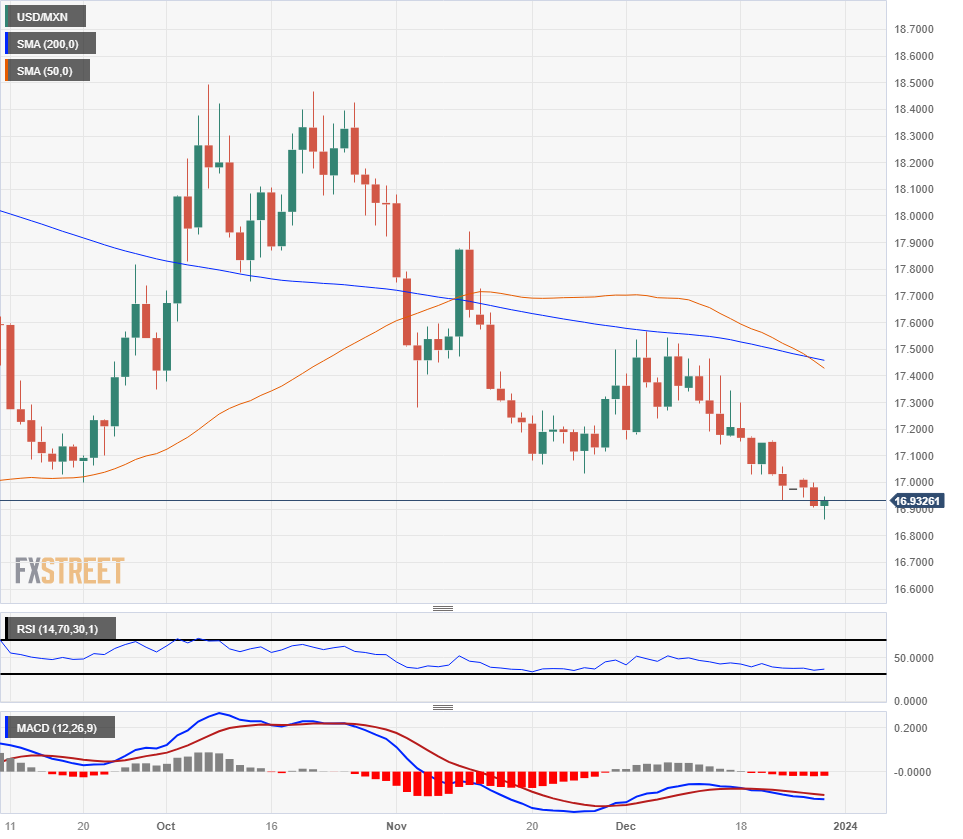
Technical Analysis: Mexican Peso stretching for further gains to wrap up the year, USD/MXN sinks in rough trading
The Mexican Peso (MXN) climbed to a fresh 16-week high against the US Dollar on Thursday, sending the USD/MXN to a multi-month low of 16.86. The pair has steadily declined through the shortened trading week and fell nearly a full percent peak-to-trough before a broad-market rebound in the US Dollar across the broader market space.
The USD/MXN is poised to close in the red for the third straight week and is set to close December in the red as well, rounding out one of the US Dollar’s worst-performing years against the Peso to date, closing lower for 9 of the past 12 straight months.
Ongoing selling pressure has brought the USD/MXN within multi-year lows near 16.60, and a break below this level would mark the pair’s weakest bids since December 2015.
On the high side, the 200-day Simple Moving Average (SMA) is parked near 17.45, and bearish cross of the 50-day SMA is chalking in a long-term resistance barrier to cap off any bullish reversals.
USD/MXN Hourly Chart
USD/MXN Daily Chart
Interest rates FAQs
Interest rates are charged by financial institutions on loans to borrowers and are paid as interest to savers and depositors. They are influenced by base lending rates, which are set by central banks in response to changes in the economy. Central banks normally have a mandate to ensure price stability, which in most cases means targeting a core inflation rate of around 2%.
If inflation falls below target the central bank may cut base lending rates, with a view to stimulating lending and boosting the economy. If inflation rises substantially above 2% it normally results in the central bank raising base lending rates in an attempt to lower inflation.
Higher interest rates generally help strengthen a country’s currency as they make it a more attractive place for global investors to park their money.
Higher interest rates overall weigh on the price of Gold because they increase the opportunity cost of holding Gold instead of investing in an interest-bearing asset or placing cash in the bank.
If interest rates are high that usually pushes up the price of the US Dollar (USD), and since Gold is priced in Dollars, this has the effect of lowering the price of Gold.
The Fed funds rate is the overnight rate at which US banks lend to each other. It is the oft-quoted headline rate set by the Federal Reserve at its FOMC meetings. It is set as a range, for example 4.75%-5.00%, though the upper limit (in that case 5.00%) is the quoted figure.
Market expectations for future Fed funds rate are tracked by the CME FedWatch tool, which shapes how many financial markets behave in anticipation of future Federal Reserve monetary policy decisions.