


With war breaking out in the Middle East and an energy crisis ongoing, global economic uncertainty has been through the roof these days.
So why has gold been crashing?
Gold hit an all-time high of $5,589 in January 2026, then proceeded to fall about 22% below $4,400 by late March. That’s one of the worst weekly routs for the metal since 2011!
If you assumed “conflict = gold up forever,” the past week just proved that rule has some very big exceptions.
Here’s what actually happened and why it matters for how you think about safe-haven assets going forward.
The Basics: Gold’s Rollercoaster Ride
Gold had an extraordinary 2025. It surged roughly 65% through 2025, fueled by a perfect storm of de-dollarization trends, massive central bank buying, and geopolitical uncertainty. By late January 2026, it had reached an all-time record of $5,589 per troy ounce.
Then things started to break down.
In late February, the U.S. and Israel launched strikes on Iran, closing key parts of the Strait of Hormuz and sending Brent crude oil surging above $100/barrel, up more than 40% since the conflict began.
You’d expect gold to rally. Instead, it started falling. Fast.
By March 19, gold was trading as low as $4,551, marking a decline of roughly 18.5% in under two months. The sell-off stretched to seven consecutive losing sessions, the longest since 2023.
So, what went wrong? Three forces hit gold at the same time:
1. A hawkish Federal Reserve. On March 18, the Fed held rates steady at 3.5%–3.75% but signaled only one rate cut for all of 2026, down from the two or three that markets had hoped for earlier in the year.
2. Rising real yields. The 10-year Treasury yield climbed, making yield-bearing bonds more attractive compared to gold, which pays nothing.
3. A strengthening U.S. dollar. The DXY (Dollar Index) pushed above 100, making gold more expensive for buyers in other currencies and reducing global demand.
When yields and the dollar move decisively, they can override the geopolitical support that traders expect from gold.
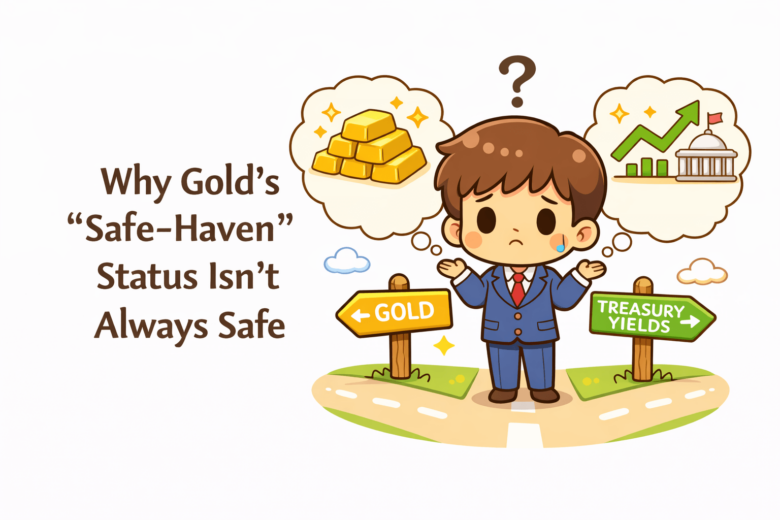
Why It Matters: The Safe-Haven Paradox
It’s important to remember that geopolitical crises don’t automatically push gold higher. What usually matters is how the crisis affects interest rates and the dollar.
In this case, the Iran war sent oil prices skyrocketing. Higher oil means higher inflation. Higher inflation means the Fed can’t exactly cut rates. And when the Fed can’t cut rates, real yields (interest rates minus inflation expectations) rise. Gold, which pays no interest, becomes less attractive compared to Treasuries that now offer a decent return.
Think of it this way: gold is competing for your money against bonds and savings accounts. When those start paying better, gold has to work harder to justify its spot in a portfolio.
Simultaneously, “momentum traders” and retail investors who piled in during 2025’s rally started heading for the exits. When sentiment shifts, it exits fast.
Promoted: Stop Risking Your Own Capital on Unpredictable Trade Policies.
You’ve seen how gold appeared to lose its safe-haven appeal in the Middle East conflict, but playing big macro shifts requires serious capital. With FundingPips, you trade a simulated account and can earn up to 100% of your rewards. Whether you’re looking for a 2 Step PRO evaluation starting at just $26 or seeking funding options up to $300K, you have the flexibility to trade your way.
Learn more about FundingPips and use code HELLO to get 20% OFF your first purchase!
Disclosure: We may earn a commission from our partners if you sign up through our links, at no extra cost to you.
Key Lessons for Traders
1. Safe-havens aren’t guaranteed safe. Context matters.
Gold’s “safe haven” status depends on what kind of crisis you’re in. During a banking panic or a currency collapse, gold shines. But when a geopolitical shock causes inflation to rise, and the Fed responds by staying restrictive, gold can actually suffer from the same crisis that’s supposed to support it. That’s exactly what happened here.
2. Real yields are gold’s kryptonite.
When real yields rise, gold tends to fall. When real yields fall, gold tends to rise. It’s not a perfect relationship, but it explains the vast majority of gold’s short-term moves. Watch the 10-year TIPS yield (real yield) as your daily indicator for gold.
The Fed’s hawkish March meeting, which projected only one cut in 2026 and revised inflation forecasts upward to 2.7%, was the trigger that sent real yields climbing and gold tumbling.
3. Dollar strength = gold headwinds.
Gold is priced globally in U.S. dollars. When the dollar strengthens, it takes fewer dollars to buy an ounce, suppressing the price. A stronger dollar also makes gold more expensive for buyers in euros, yen, or yuan, reducing international demand. Keep an eye on DXY when trading gold.
4. Crowded trades unwind violently.
After a 65% surge in 2025, gold had attracted a huge number of short-term traders who were not long-term believers in the metal. When sentiment shifted, these traders headed for the exits simultaneously, amplifying the selloff well beyond what fundamentals alone would justify.
5. The long-term story isn’t broken.
Here’s the important flip side: none of the structural drivers that pushed gold from $2,600 to $5,500 have actually disappeared. Central banks are still buying. U.S. fiscal deficits are still enormous. De-dollarization trends are still intact. Major banks like J.P. Morgan and Deutsche Bank maintained year-end 2026 price targets of $6,000+ even after the crash. The current pullback looks like a tactical correction inside a larger bull market—painful, but not necessarily the end.
The Bottom Line
Gold’s 17-18% crash from its January highs is a textbook example of what happens when a geopolitical crisis triggers inflation fears rather than flight-to-safety flows.
The Iran war didn’t push gold up—it pushed oil up, which pushed inflation up, which pushed the Fed to stay hawkish, which pushed real yields up, which pushed gold down. That chain of events is counterintuitive, but it’s one of the most important patterns in macro trading.
What to watch going forward: keep your eye on U.S. real yields, the DXY, and any signs of the Fed softening its tone on rate cuts. If oil prices stabilize and inflation expectations ease, gold’s structural tailwinds could reassert themselves quickly. The $4,200 level around the 200-day moving average is widely viewed as the line between a bull and bear market for gold.
For now, the lesson is simple: understand why an asset is called a safe haven before you assume it will always behave that way.
Promoted: Master Your Execution During Macro Shocks
When gold prices crash despite geopolitical uncertainty, does your execution stay clinical or get emotional? TradeZella’s trade replay tool lets you revisit your past trades tick-by-tick. See exactly where your entry slipped or why you hesitated, so you can dominate the next volatility spike with a data-driven playbook.
Start Your Journal with Tradezella and use code “PIPS20” to save 20% on your first purchase!
Disclosure: To help support our free daily content, we may earn a commission from our partners if you sign up through our links, at no extra cost to you.


